Published: 2026-03-16T01:51:28.000Z
Chart EUR/USD Update: Consolidating at fresh year low
1
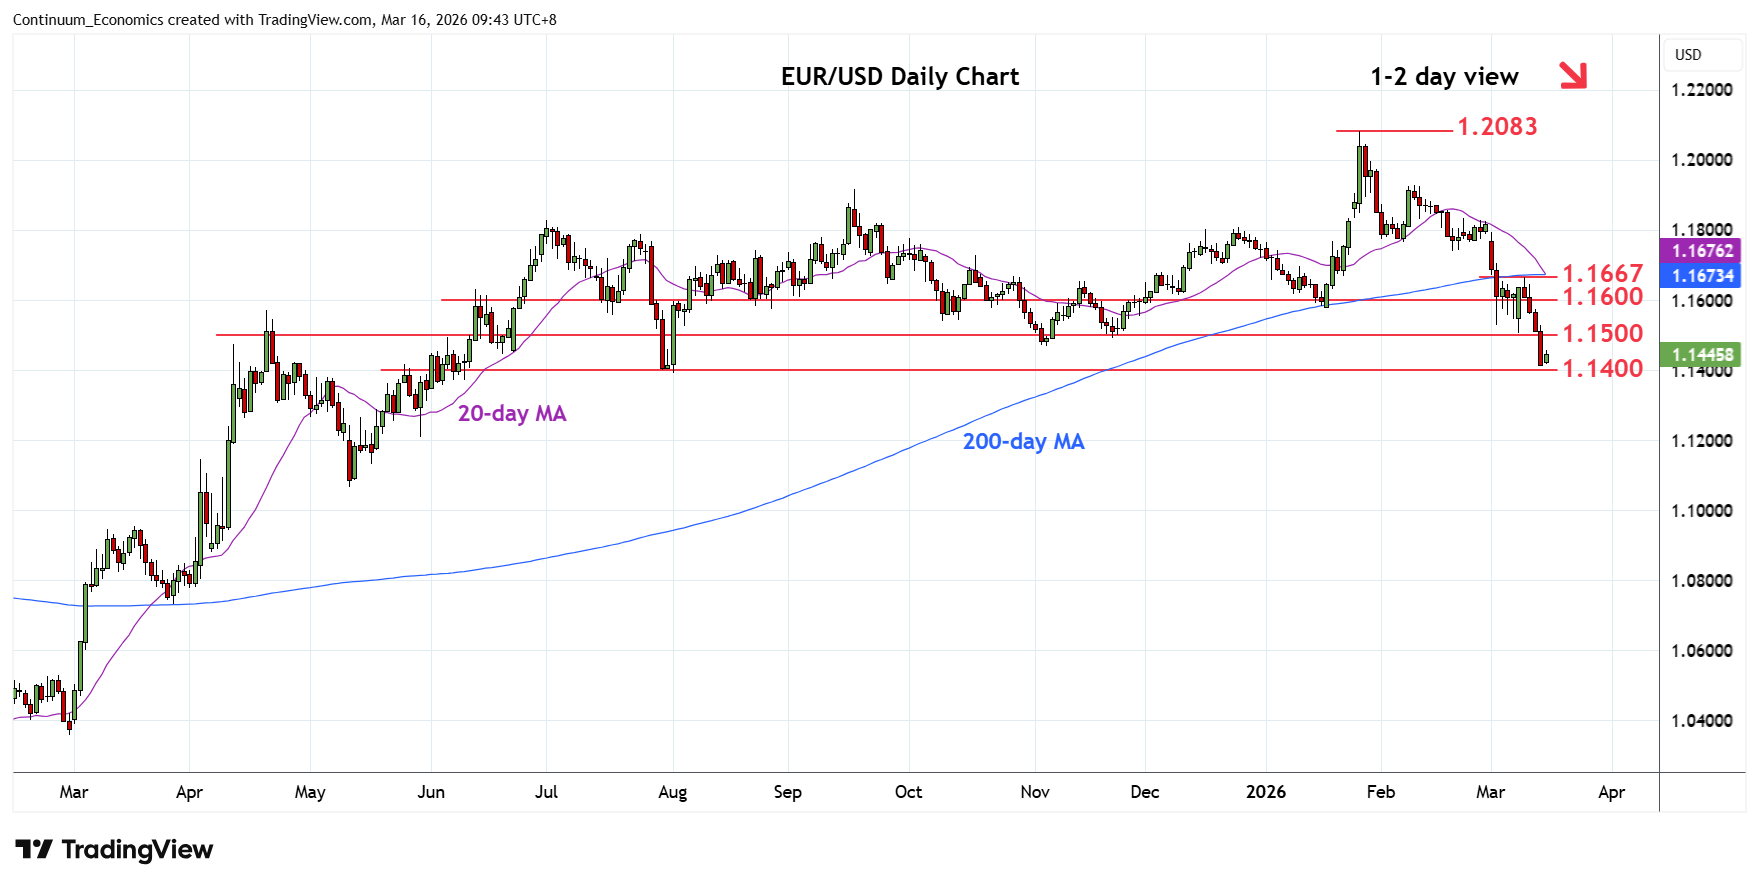
Saw break of the 1.1500 level on Friday to reach fresh year low at 1.1410
| Levels | Imp | Comment | Levels | Imp | Comment | |||
|---|---|---|---|---|---|---|---|---|
| R4 | 1.1700 | * | congestion | S1 | 1.1400 | * | congestion | |
| 14 | 1.1667 | ** | 10 Mar high | S2 | 1.1355 | * | 38.2% 2025/Jan rally | |
| R2 | 1.1600 | * | congestion | S3 | 1.1300 | * | congestion | |
| R1 | 1.1500/30 | * | congestion, 3 Mar low | S4 | 1.1275/00 | ** | 2023/2024 year highs |
Asterisk denotes strength of level
01:45 GMT - Saw break of the 1.1500 level on Friday to reach fresh year low at 1.1410. Consolidation here see prices unwinding oversold intraday studies but a later break cannot be ruled out. Lower will further retrace gains from the low of January 2025 year low and see room to support at 1.1400/1.1355 congestion and 38.2% Fibonacci level. Oversold daily studies suggest reaction at the latter likely. Meanwhile, resistance is lowered to the 1.1500/30 level and 3 March low which is expected to cap. Regaining this will ease the downside pressure and see room for stronger bounce to the 1.1600.