Chartbook: US Chart 10 Year Yield: Extending consolidation - background studies under pressure
Still little change, as prices extend consolidation above congestion support at 4.000%
Still little change, as prices extend consolidation above congestion support at 4.000%.
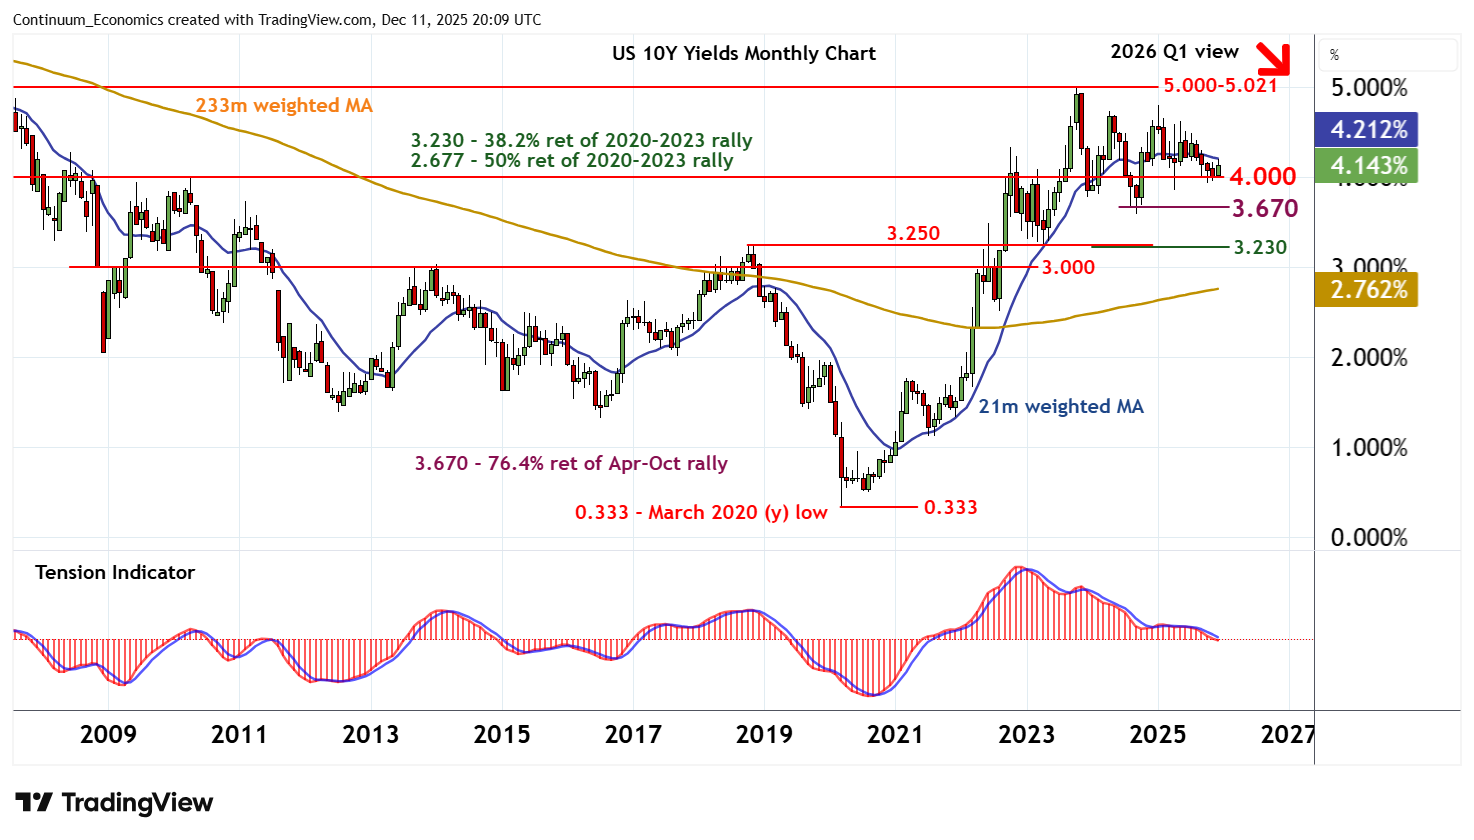
Monthly studies continues to track lower, highlighting room for a break and a test of critical support at the 3.670% Fibonacci retracement and the 3.599% year low of September 2024.
However, already oversold monthly stochastics could limit any initial tests of this range in fresh consolidation, before the bearish monthly Tension Indicator and deteriorating longer-term readings prompt further losses.
A later close beneath here will turn sentiment outright negative and confirm a near-term top in place at the 5.021% multi-year high of October 2023. A deeper correction of the 2020-2023 rally will then open up support at the 3.230% Fibonacci retracement and the 3.250% year high of October 2018.
Meanwhile, immediate resistance is at the 4.250% break level and extends to congestion around 4.500%.
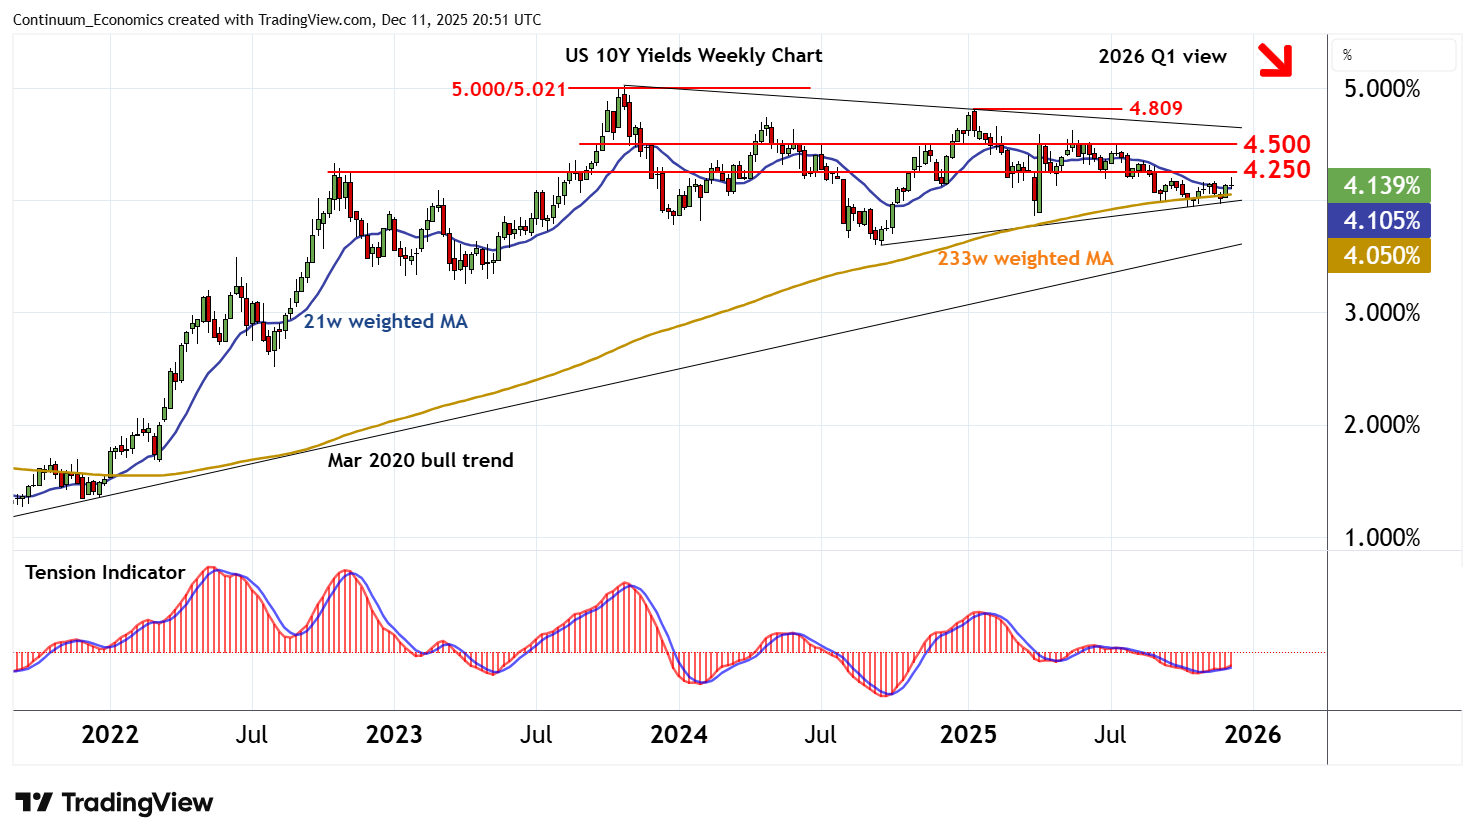
Rising weekly stochastics and the positive weekly Tension Indicator highlight potential for a test into this range.
But bearish monthly and longer term studies should limit any tests in renewed selling interest towards 4.500%.
A close above here, however, will improve sentiment and open up the 4.809% current year high of 14 January.