Published: 2026-02-09T08:57:02.000Z
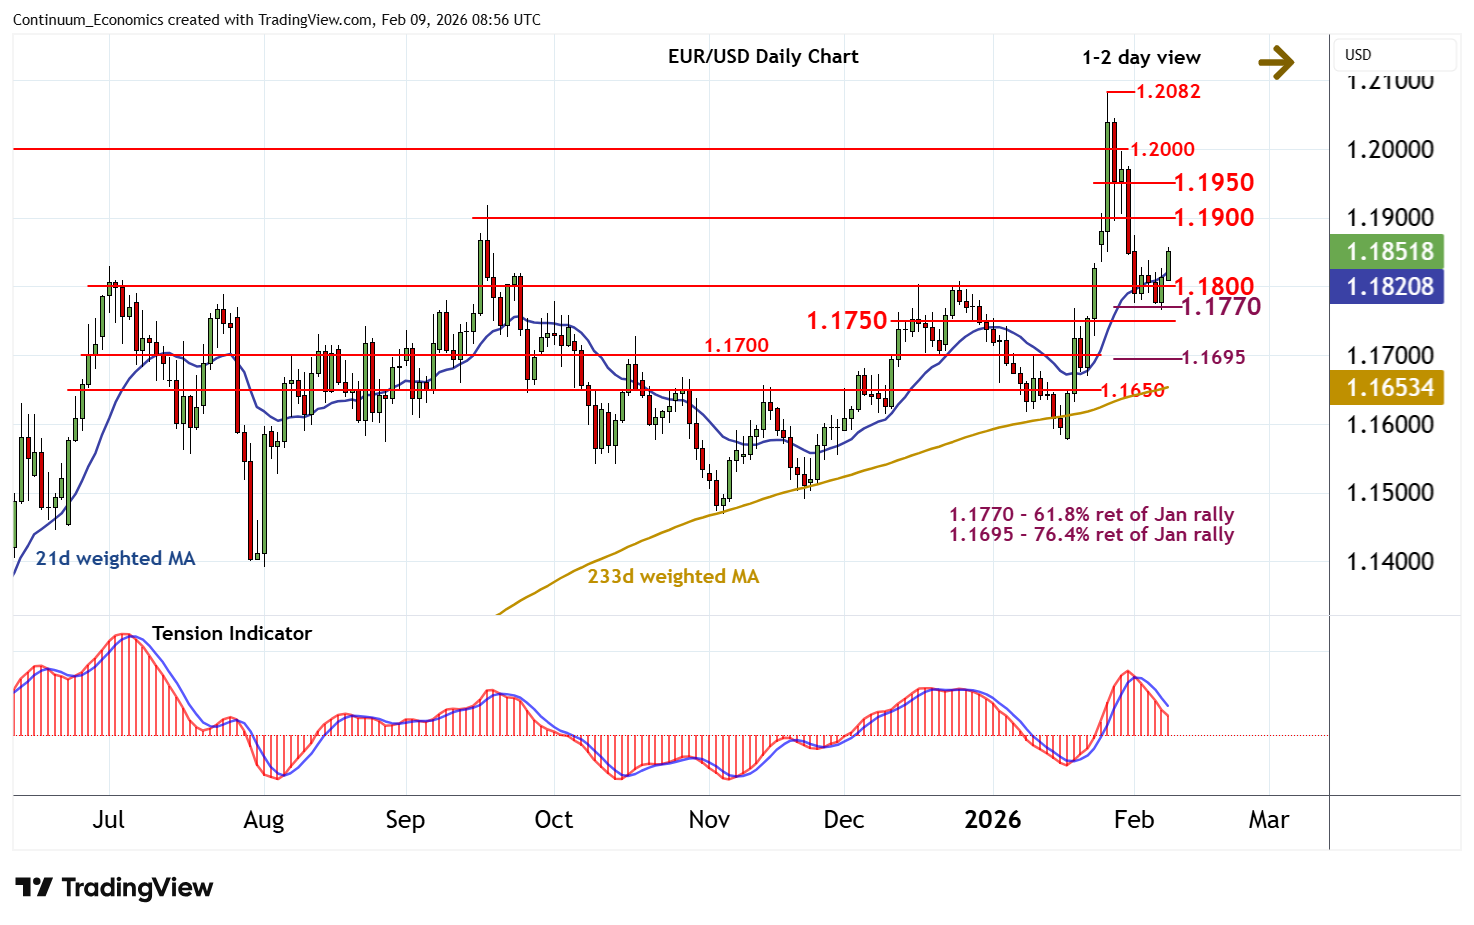
Chart EUR/USD Update: Strong resistance at 1.1900
2
The bounce from the 1.1770 Fibonacci retracement is extending
| Levels | Imp | Comment | Levels | Imp | Comment | |||
|---|---|---|---|---|---|---|---|---|
| R4 | 1.2082 | ** | 27 Jan YTD high | S1 | 1.1800 | * | congestion | |
| R3 | 1.2000 | ** | figure | S2 | 1.1770 | ** | 61.8% ret of January rally | |
| R2 | 1.1950 | break level | S3 | 1.1750 | * | congestion | ||
| R1 | 1.1900 | * | congestion | S4 | 1.1695/00 | ** | 76.4% ret; congestion |
*Asterisk denotes strength of level
08:50 GMT - The bounce from the 1.1770 Fibonacci retracement is extending, with prices currently trading around 1.1850. Rising intraday studies highlight room for continuation towards congestion resistance at 1.1900. But negative daily readings and mixed weekly charts should limit any tests in renewed consolidation/selling interest. Meanwhile, support is at congestion around 1.1800 and extends to 1.1770. This range should underpin any immediate setbacks. A break, if seen, will add weight to sentiment and extend losses beneath 1.1750 towards strong support at 1.1695/00, where fresh consolidation is expected to appear.