Chart USD Index DXY Update: Lower in profit-taking
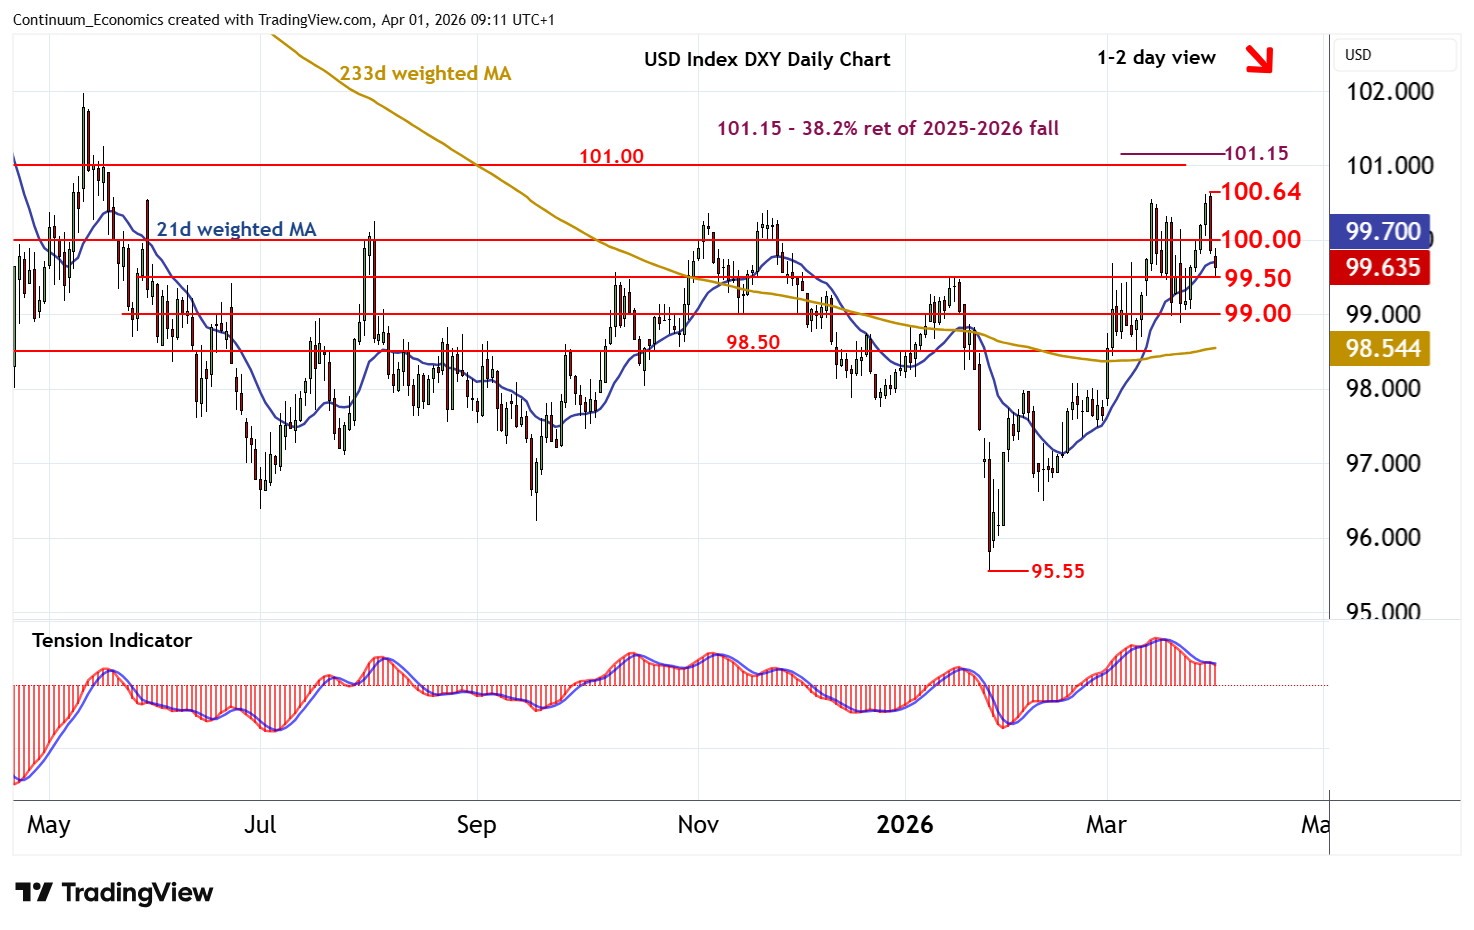
Consolidation beneath the 100.64 current year high of 31 March is giving way to a deeper pullback
| Levels | Imp | Comment | Levels | Imp | Comment | |||
|---|---|---|---|---|---|---|---|---|
| R4 | 101.15 | ** | 38.2% ret of 2025-2026 fall | S1 | 99.50 | * | congestion | |
| R3 | 101.00 | * | congestion | S2 | 99.00 | ** | congestion | |
| R2 | 100.64 | ** | 31 Mar YTD high | S3 | 98.88 | 23 Mar (w) low | ||
| R1 | 100.00 | ** | congestion | S4 | 98.50 | * | congestion |
Asterisk denotes strength of level
08:55 BST - Consolidation beneath the 100.64 current year high of 31 March is giving way to a deeper pullback, as profit-taking pressure increases, with prices currently consolidating the test of congestion support at 99.50. Daily readings have turned down and overbought weekly stochastics are unwinding, highlighting room for a later break beneath here towards further congestion around 99.00. The positive weekly Tension Indicator and rising longer-term charts could limit any initial tests of here in fresh consolidation. Meanwhile, resistance is lowered to congestion around 100.00. A close above here would help to stabilise price action. But a further close above 100.64 is needed to turn sentiment positive and confirm continuation of late-January gains.