Chart USD/CAD Update: Extending pressure on 1.3900/20 - studies improving
Little change, as rising intraday studies keep near-term price action buoyant
| Levels | Imp | Comment | Levels | Imp | Comment | |||
|---|---|---|---|---|---|---|---|---|
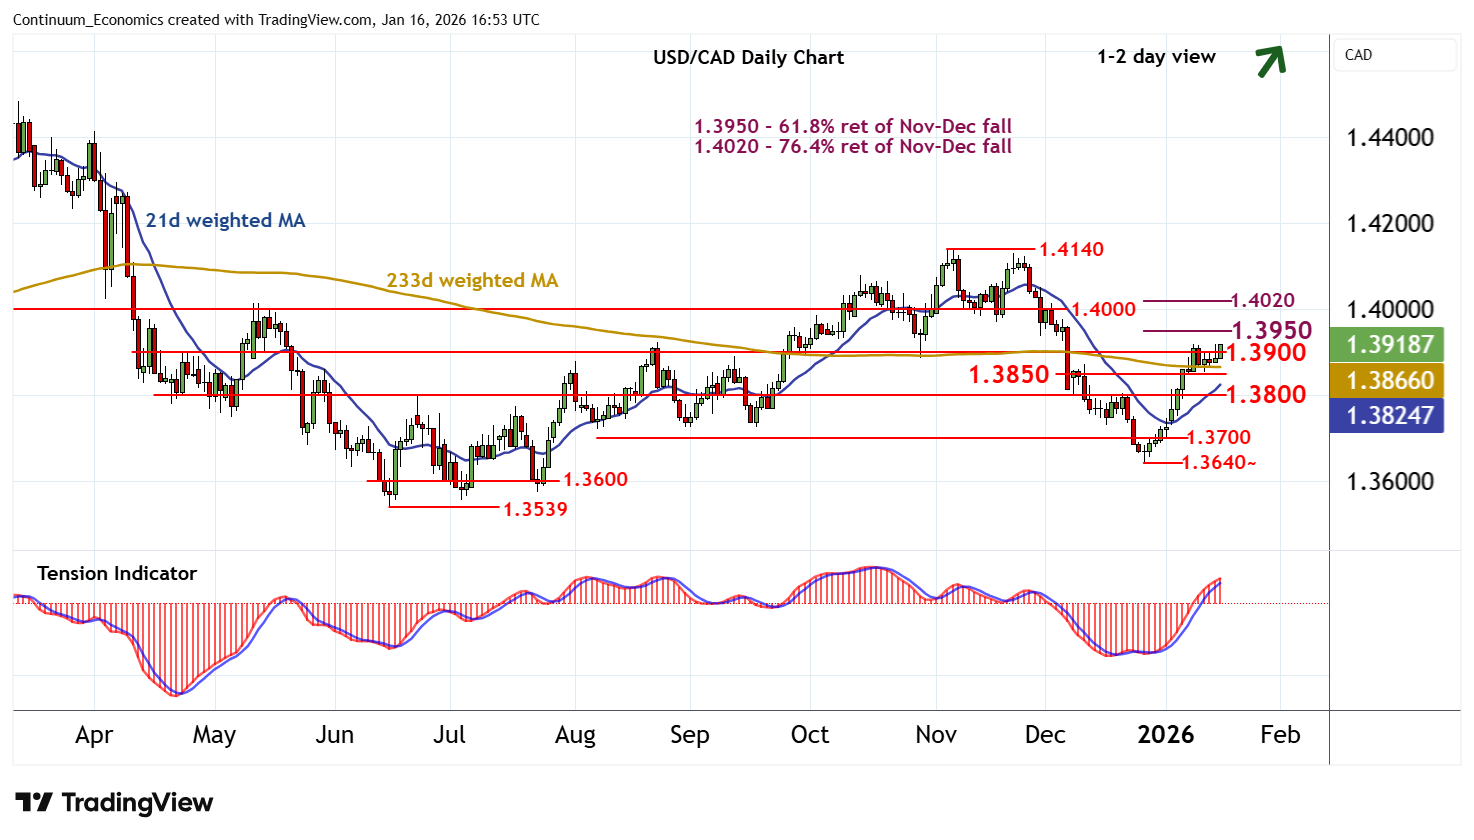
| R4 | 1.4020 | ** | 76.4% ret of Nov-Dec fall | S1 | 1.3850 | congestion | ||
| R3 | 1.4000 | ** | congestion | S2 | 1.3800 | ** | congestion | |
| R2 | 1.3950 | ** | 61.8% ret of Nov-Dec fall | S3 | 1.3700 | * | congestion | |
| R1 | 1.3900/20 | ** | break level; 9 Jan (w) high | S4 | 1.3640 | * | 26 Dec (w) low |
Asterisk denotes strength of level
16:45 GMT - Little change, as rising intraday studies keep near-term price action buoyant and extend pressure on resistance at 1.3900/20. The daily Tension Indicator continues to rise and overbought daily stochastics have ticked higher once again, highlighting room for further strength in the coming sessions. A break above here will open up the 1.3950 Fibonacci retracement. Rising weekly charts highlight room for continuation towards the 1.4000/20 range, where profit-taking interest could increase. Meanwhile, support remains at congestion around 1.3850. A close beneath here, if seen, will turn sentiment neutral and prompt consolidation above 1.3800.