Published: 2026-03-03T00:30:58.000Z
Chart AUD/USD Update: Sideways in consolidation
1
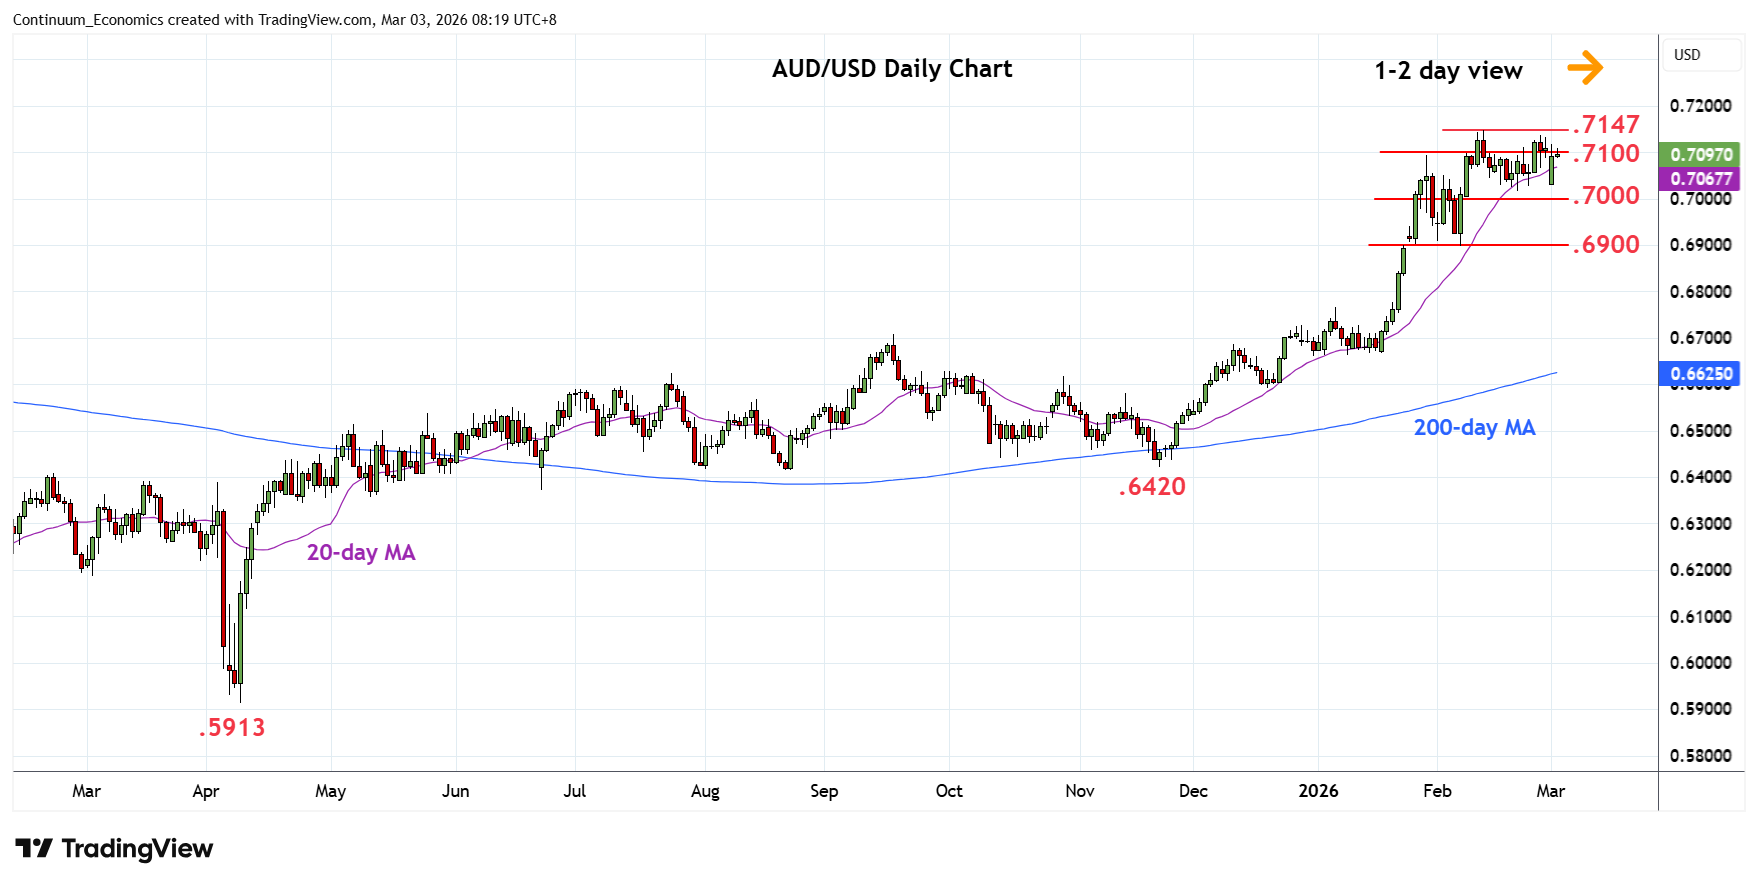
Extend choppy trade below the .7147 February current year high with prices well supported above the .7015/00 area
| Levels | Imp | Comment | Levels | Imp | Comment | |||
|---|---|---|---|---|---|---|---|---|
| R4 | 0.7280 | * | Jun 2022 high | S1 | 0.7015/00 | * | 20 Feb low, congestion | |
| R3 | 0.7205 | * | 61.8% 2021/2025 fall | S2 | 0.6950 | * | congestion | |
| R2 | 0.7147 | ** | 12 Feb YTD high | S3 | 0.6900 | ** | congestion, 6 Feb low | |
| R1 | 0.7100 | * | congestion | S4 | 0.6870 | * | 38.2% Nov/Feb rally |
Asterisk denotes strength of level
00:20 GMT - Extend choppy trade below the .7147 February current year high with prices well supported above the .7015/00 area. Daily studies have turned down from overbought readings and suggest scope for break here to open up room for deeper pullback to retrace gains from the .6420, November low. Lower will see room to strong support at the .6900 level. Meanwhile, resistance remains at the .7100 congestion and this extend to the .7147 high is expected to cap. Break here will extend the bull trend from the April low and see room to .7205, 61.8% Fibonacci retracement.