U.S. March Personal Income and Spending - Q1 totals confirmed, Core PCE Prices provide some relief

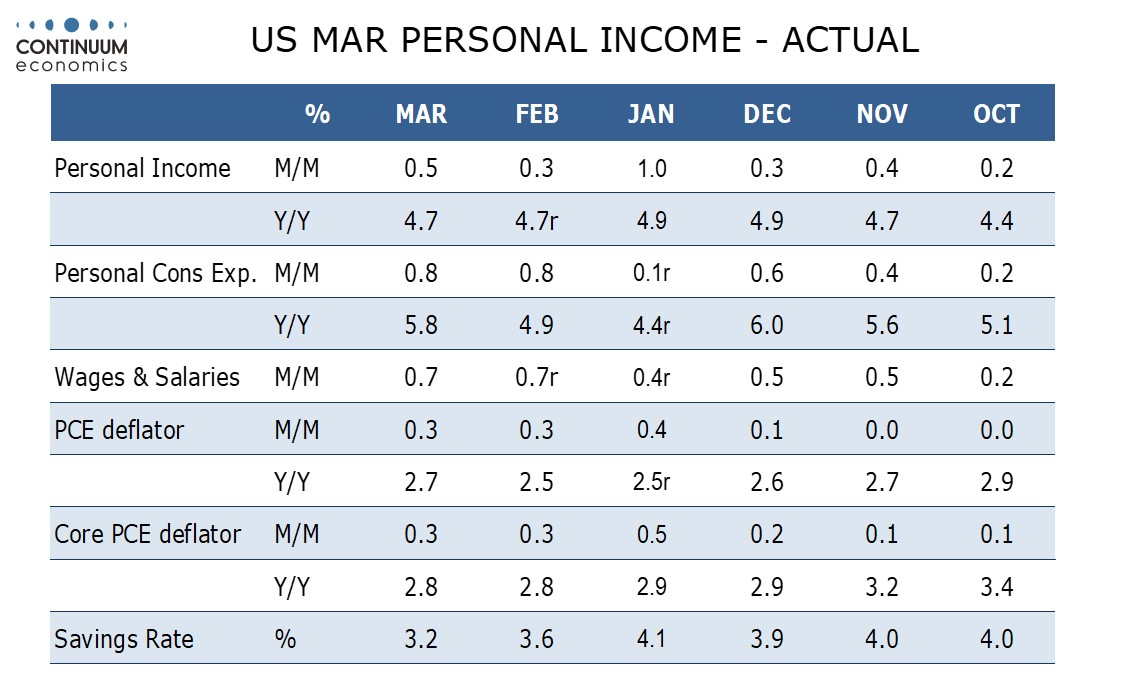
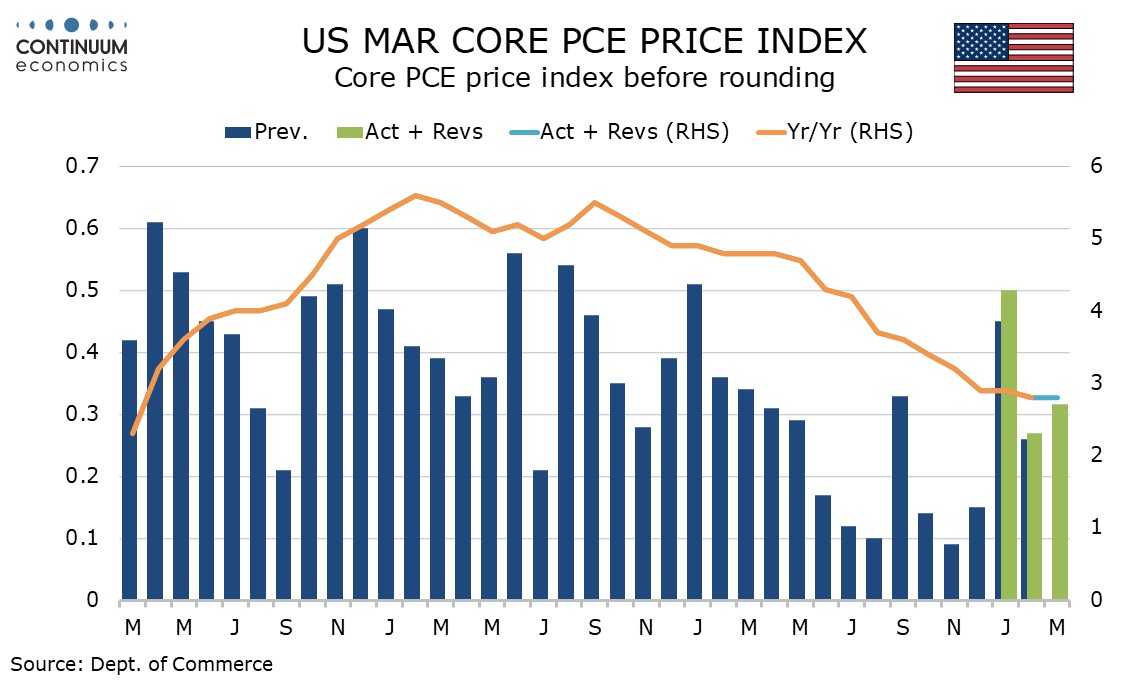
March’s personal income and spending data confirms the Q1 totals released with the GDP report. Core PCE prices at 0.3% provide some relief by avoiding the 0.4% implied by Q1’s stronger than expected 3.7% annualized rise. March rose by 0.317% before rounding with revisions to February (to 0.266% from 0.261%) and particularly January (to 0.502% from 0.452%) explaining the rest of the Q1 surprise (both therefore unrevised before rounding).
The core PCE price data is looking similar to the corresponding months of 2023, which saw gains of 0.51% in January, 0.36% in February and 0.34% in March. Yr/yr data is still coming down even if March was unchanged from February at 2.8% after rounding. In the remainder of 2023 only April and September reached 0.3% on the month before rounding. We believe that inflationary data will lose momentum in the remainder of 2024.
Overall PCE prices also rose by 0.3% on the month but yr/yr growth increased to 2.7% from 2.5%.
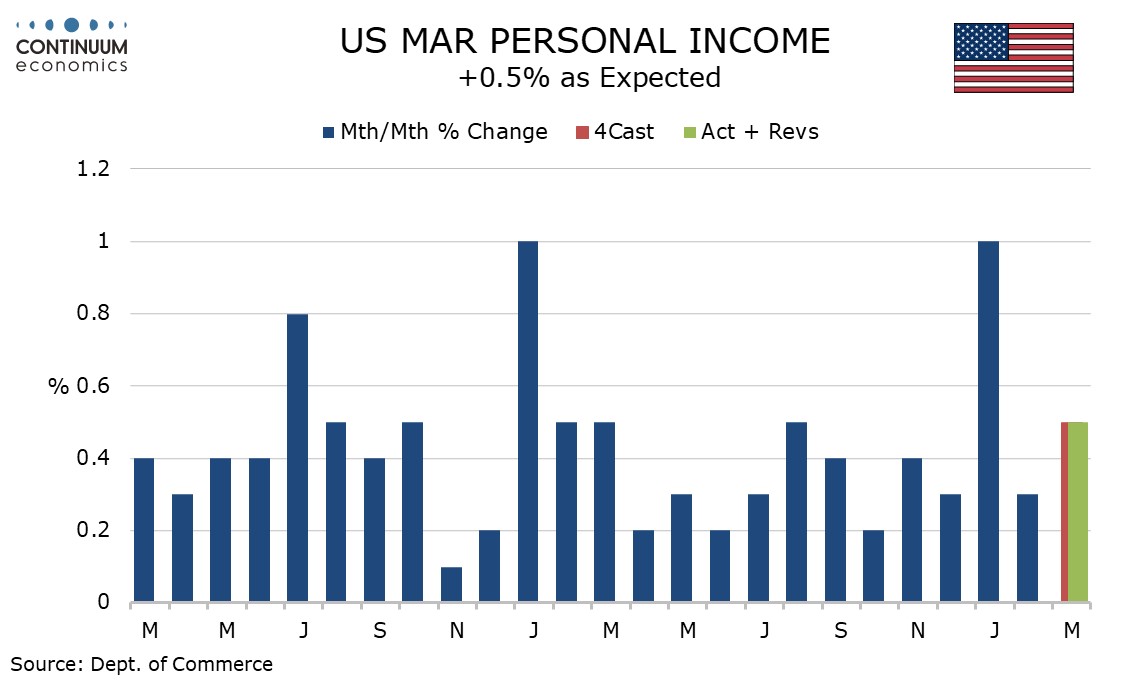
Personal income rose by 0.5% as expected with no significant revisions. Wages and salaries rose by 0.7% while the other components returned to trend after a very strong January was corrected in February.
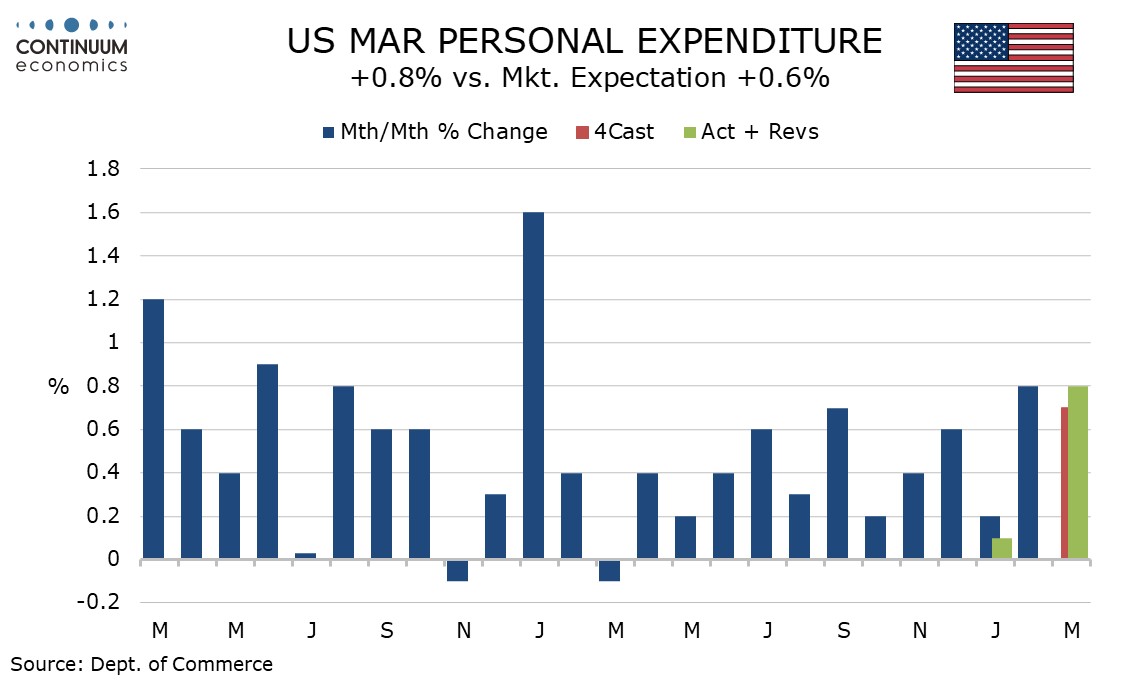
Personal spending was up by a stronger than expected 0.8% without the upward revisions retail sales revisions had implied, due to offsetting negative revisions in services. February was unrevised to 0.8% and January revised don to 0.1% from 0.2%. January weakness was confined to goods with services still strong in Q1 despite the negative revisions. March services rise by 0.6%, but only a modest 0.2% in real terms.
January’s weakness was in part due to weather and consumers appear to have momentum entering Q2. However spending is outpacing income, and the savings rate in March of 3.2%, down from 3.6% in February, the lowest since October 2022. This is downside risk going forward.