Published: 2026-01-05T07:24:02.000Z
Chart GBP/JPY Update: Ranging below 211.60 high
1
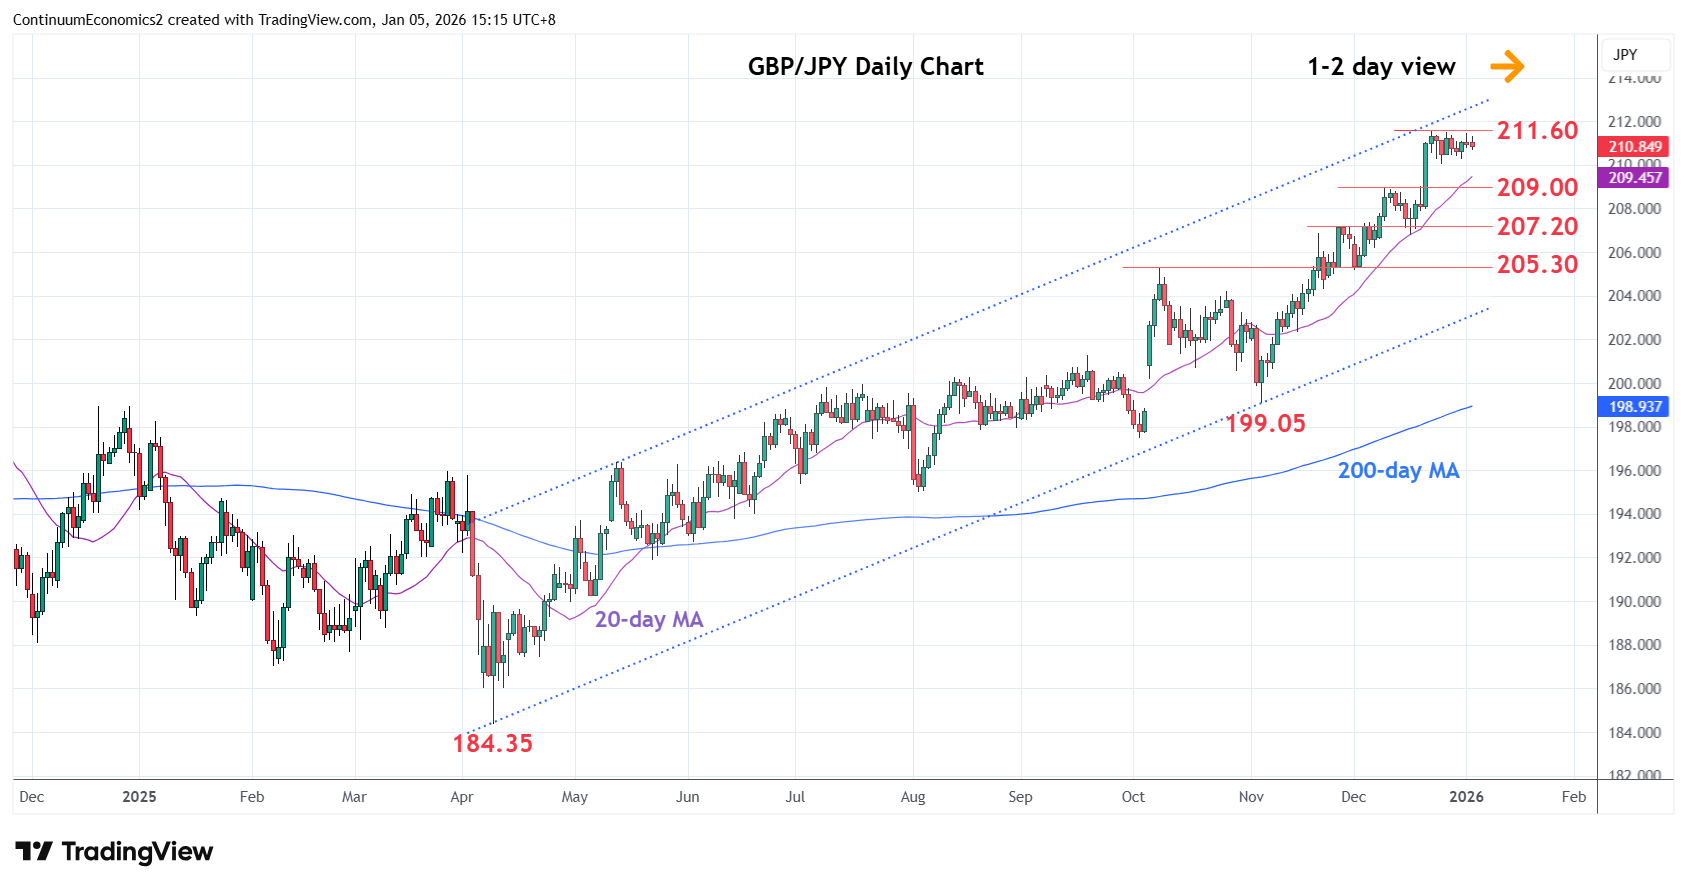
Little change, as prices extend consolidation below the 211.60, December 2025 year high
| Levels | Imp | Comment | Levels | Imp | Comment | |||
|---|---|---|---|---|---|---|---|---|
| R4 | 216.00 | * | Jul 2008 high | S1 | 210.00 | * | congestion | |
| R3 | 214.00/10 | * | congestion, Aug 2008 high | S2 | 209.00 | ** | 9 Dec high | |
| R2 | 212.00 | * | congestion | S3 | 208.00 | * | congestion | |
| R1 | 211.60 | ** | 22 Dec 2025 year high | S4 | 207.20 | ** | Nov high |
Asterisk denotes strength of level
07:20 GMT - Little change, as prices extend consolidation below the 211.60, December 2025 year high. The resulting flag pattern and bullish prices structure suggest this giving way to break to extend the underlying bull trend from the September 2011 year low. Break will see room to the 212.00/212.50, level and April channel resistance. Higher still, will see potential to target 214.10, August 2008 high. Meanwhile, support is raised to the 210.00 congestion which extend to the 209.00, 9 December high. Would take break of this area to open up room for deeper correction to 208.00 congestion and 207.20, November high.