Published: 2025-04-16T01:54:15.000Z
Chart EUR/USD Update: Consolidating

Technical Analyst
-
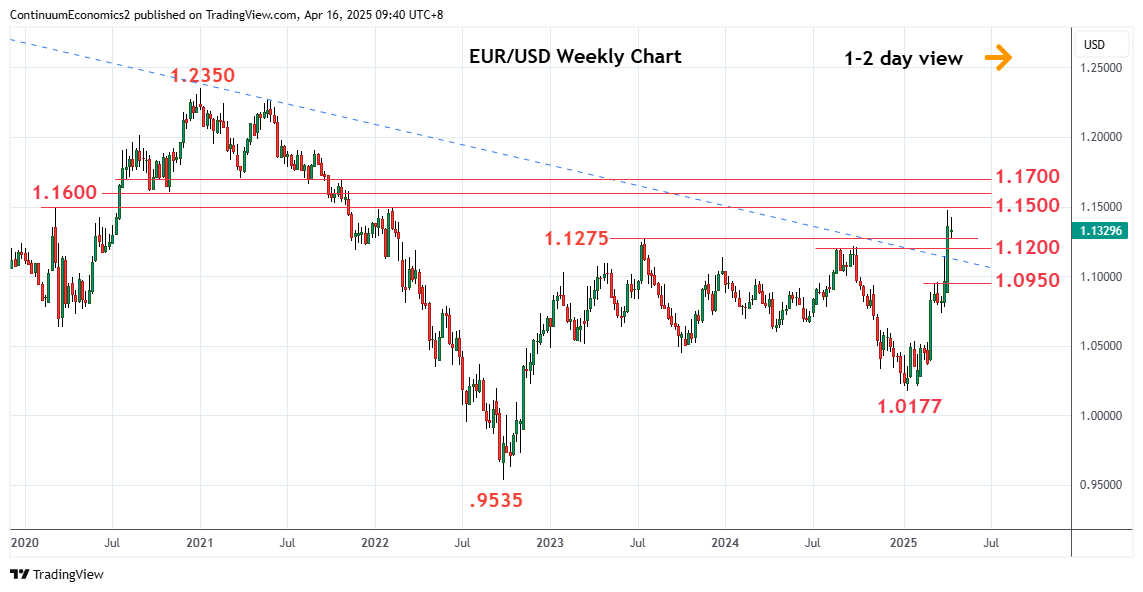
Lower in consolidation from the 1.1474 high of last week as prices unwind overbought daily studies
| Levels | Imp | Comment | Levels | Imp | Comment | |||
|---|---|---|---|---|---|---|---|---|
| R4 | 1.1700 | ** | Mar 2021 low | S1 | 1.1275 | * | Jul 2023 year high | |
| R3 | 1.1665 | * | Aug 2021 low | S2 | 1.1215/00 | * | Sep 2024 year high, congestion | |
| R2 | 1.1600 | * | congestion | S3 | 1.1145 | * | 3 Apr high | |
| R1 | 1.1495/00 | ** | Feb 2022 year high, congestion | S4 | 1.1100 | * | congestion |
Asterisk denotes strength of level
01:45 GMT - Lower in consolidation from the 1.1474 high of last week as prices unwind overbought daily studies. Pullback see support starting at the 1.1275/1.1200, 2023/2024 year highs, which should underpin. Would take break of these to open up room for deeper correction of the strong run-up from the January low to the 1.1145/1.1100 area where renewed buying interest can be expected. Meanwhile, break above the 1.1474 high and 1.1500 figure will open up room for extension to the strong resistance at the 1.1600/1.1700 area.