Published: 2026-03-12T00:45:05.000Z
Chart NZD/USD Update: Extend choppy trade within .5950/.5850 area
1
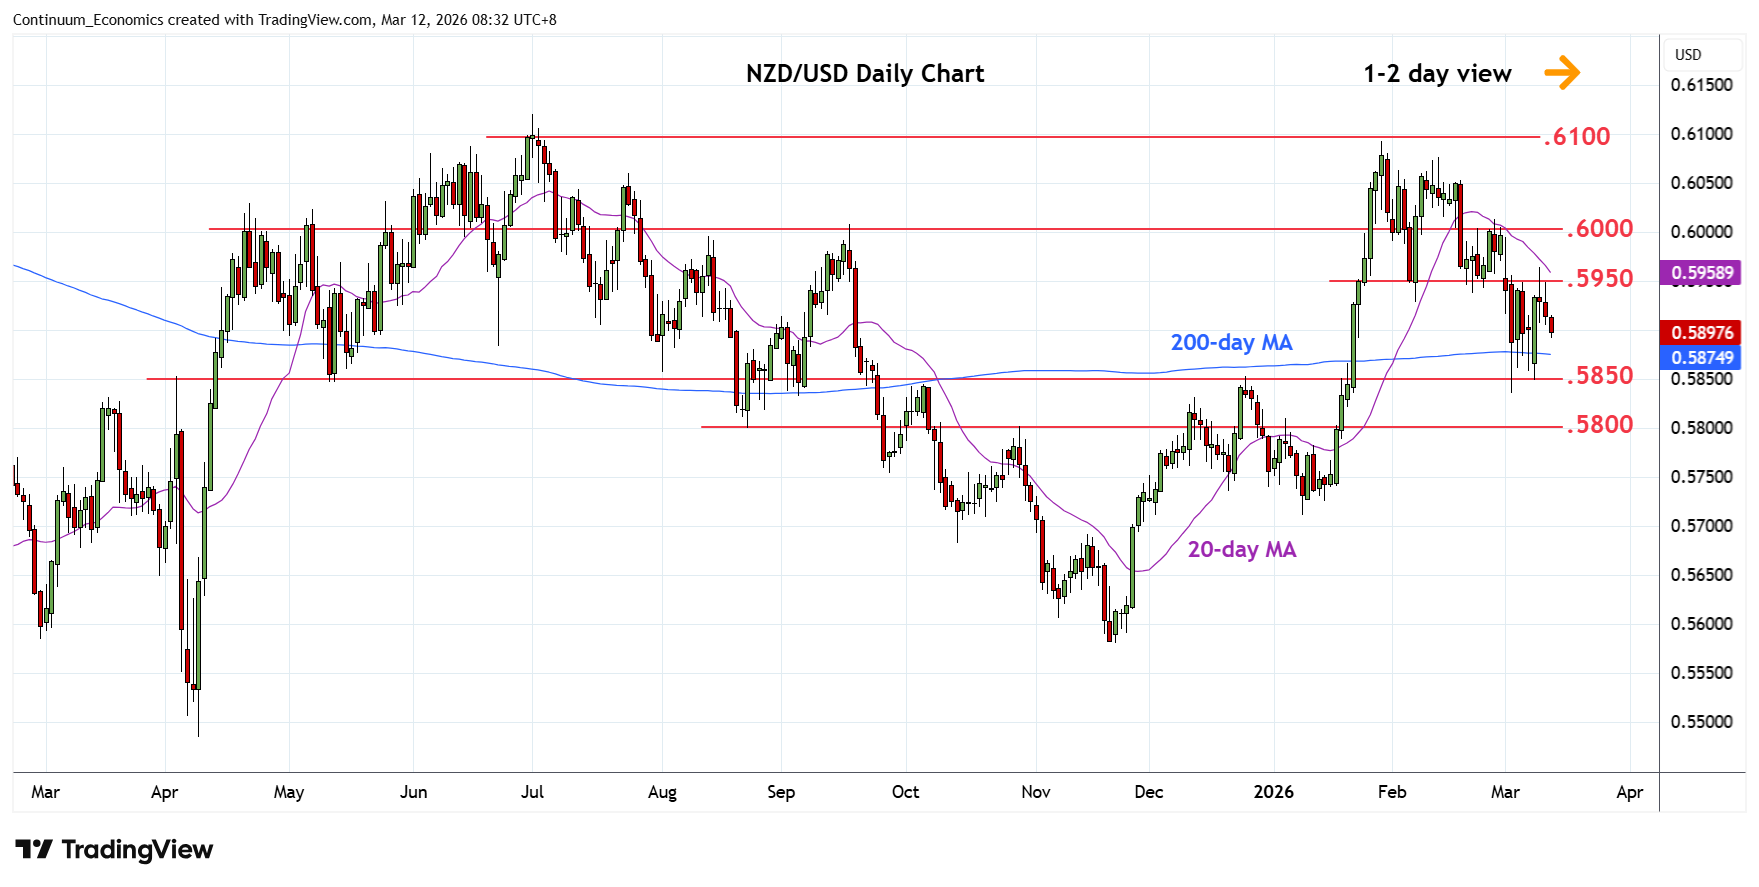
Little change, as prices extend choppy trade within the .5950/.5850 area
| Levels | Imp | Comment | Levels | Imp | Comment | |||
|---|---|---|---|---|---|---|---|---|
| R4 | .6093 | ** | 29 Jan YTD high | S1 | .5850 | * | Dec high, congestion | |
| R3 | .6050 | * | congestion | S2 | .5836 | * | 3 Mar low, 50% | |
| R2 | .6000/10 | ** | congestion, 26 Feb high | S3 | .5800 | ** | congestion | |
| R1 | .5950 | ** | congestion | S4 | .5775 | * | 61.8% Nov/Jan rally |
Asterisk denotes strength of level
00:35 GMT - Little change, as prices extend choppy trade within the .5950/.5850 area. Negative daily studies suggest scope to further pressure the .5850 support where break will open up room for deeper pullback to retrace the November/January rally to retest .5836, 50% Fibonacci level. Lower still, will turn focus to strong support at .5800/.5775, congestion and 61.8% Fibonacci level. Would take break above the .5950 resistance to fade the downside pressure and open up room for retest of the .6000 level. Clearance, will return focus to the .6050 congestion and .6093, January current year high.