Published: 2026-05-08T13:32:18.000Z
Chart EUR/JPY Update: Limited tests higher
2
Consolidation is giving way to the anticipated break above 184.00
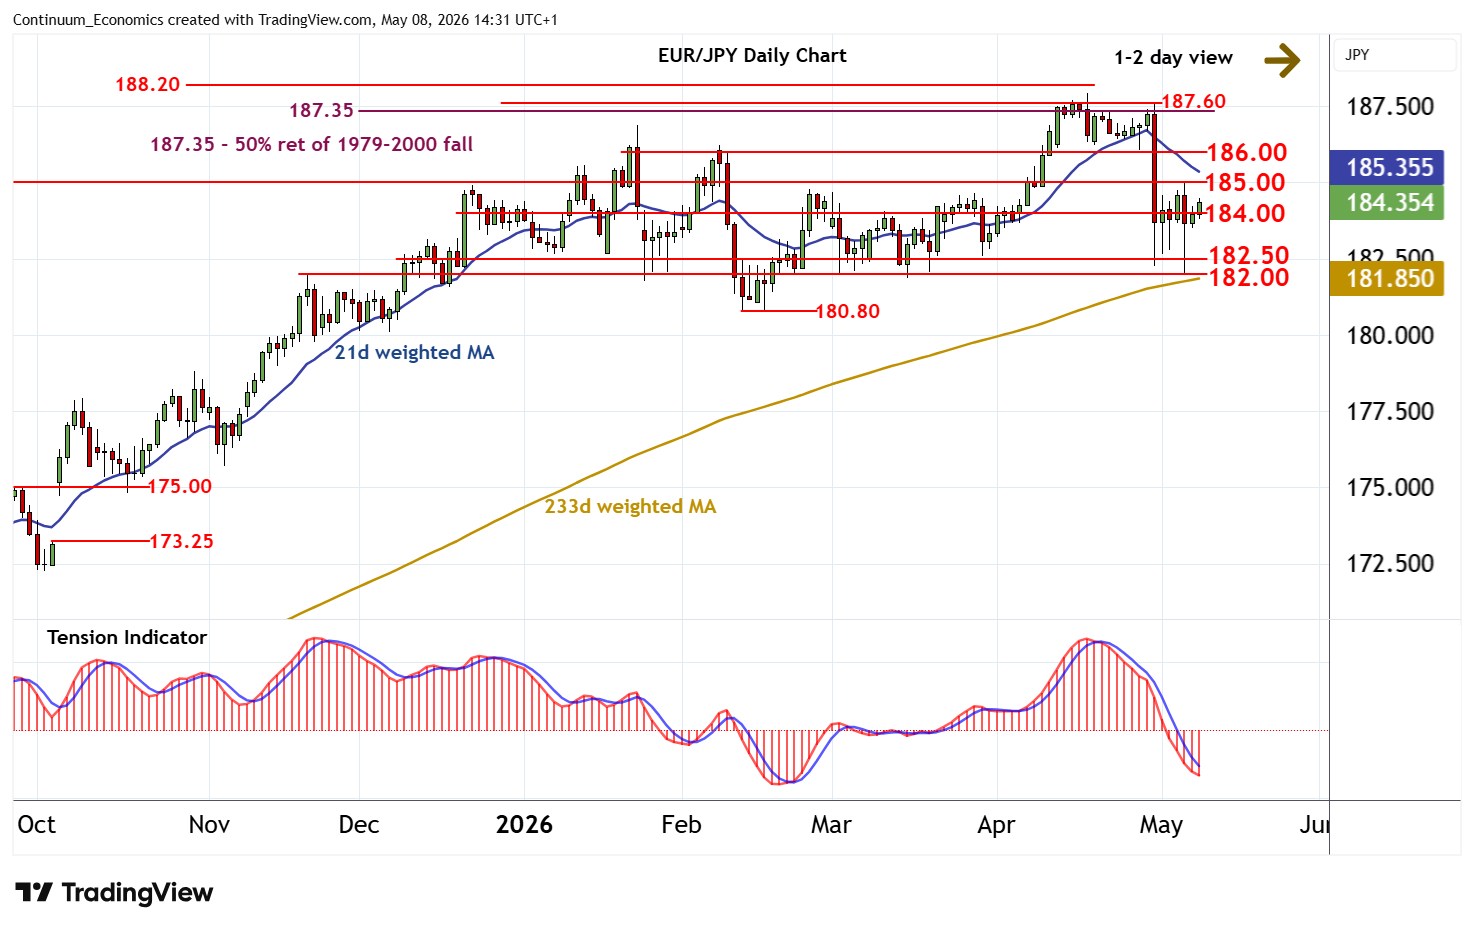
| Levels | Imp | Comment | Levels | Imp | Comment | |||
|---|---|---|---|---|---|---|---|---|
| R4 | 187.60 | ** | Aug 1990 high | S1 | 184.00 | * | congestion | |
| R3 | 187.35 | ** | 50% ret of 1979 - 2000 fall | S2 | 182.50 | * | congestion | |
| R2 | 186.00 | * | congestion | S3 | 182.00 | ** | congestion | |
| R1 | 185.00 | ** | break level | S4 | 180.80 | ** | 12 Feb YTD low |
Asterisk denotes strength of level
14:25 BST - Consolidation is giving way to the anticipated break above 184.00, with prices currently trading around 184.30. Oversold daily stochastics are rising, highlighting room for a tesdt of resistance at 185.00./ But the negative daily Tension Indicator and bearish weekly charts should prompt renewed selling interest towards here. Following cautious/corrective trade, fresh losses are looked for. A break back below 184.00 will open up congestion support around 182.50. But a close below further congestion around 182.00 is needed to turn sentiment bearish and extend mid-April losses initially to the 180.80 current year low of 12 February.