Published: 2026-01-07T00:22:11.000Z
Chart AUD/USD Update: Extending gains
1
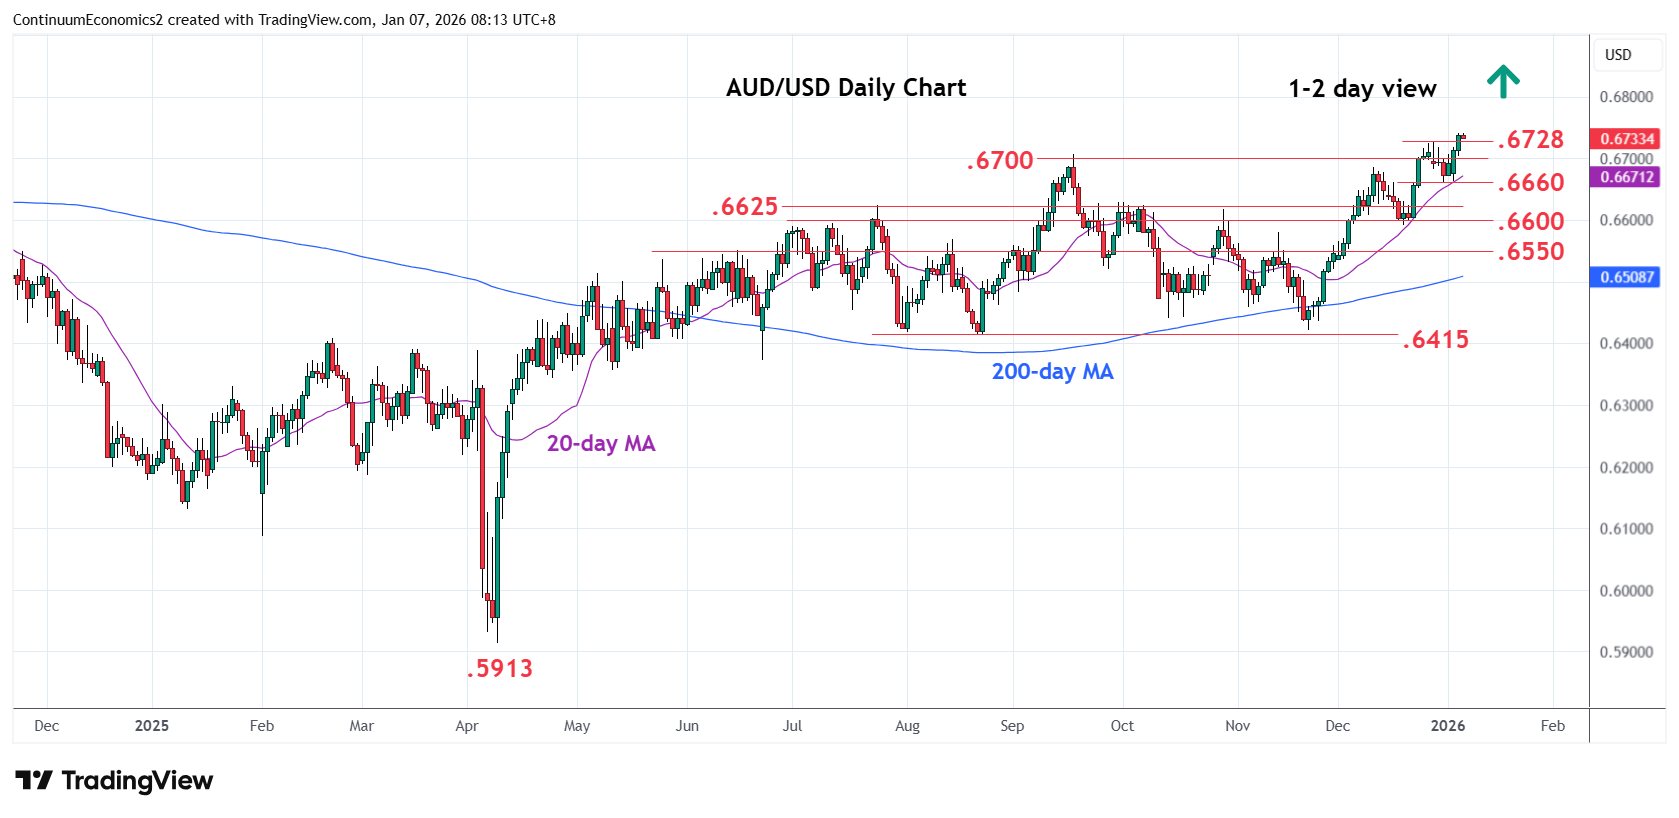
Break to fresh high through the .6728 December high see prices extending gains from the November low
| Levels | Imp | Comment | Levels | Imp | Comment | |||
|---|---|---|---|---|---|---|---|---|
| R4 | 0.6900 | * | congestion | S1 | 0.6700 | * | congestion | |
| R3 | 0.6850 | * | congestion | S2 | 0.6660 | ** | 31 Dec low | |
| R2 | 0.6800/25 | * | congestion, Aug 2024 high | S3 | 0.6625/00 | ** | Jul 2025 high, congestion | |
| R1 | 0.6750 | * | congestion | S4 | 0.6550 | * | congestion |
Asterisk denotes strength of level
00:15 GMT - Break to fresh high through the .6728 December high see prices extending gains from the November low. Bullish struture see room for further gains to retrace the losses from February 2021 year high to congestion at .6750 and .6800/25 area. Beyond this, but our of reach for now will turn focus to the .6942, 2024 year high. Deep overbought daily and weekly studies caution corrective pullback with support starting at the .6700 level and extending to the .6660 low of last week which should now underpin. Would take break here to fade the upside pressure and see room for deeper corrective pullback.