Published: 2026-03-27T07:46:11.000Z
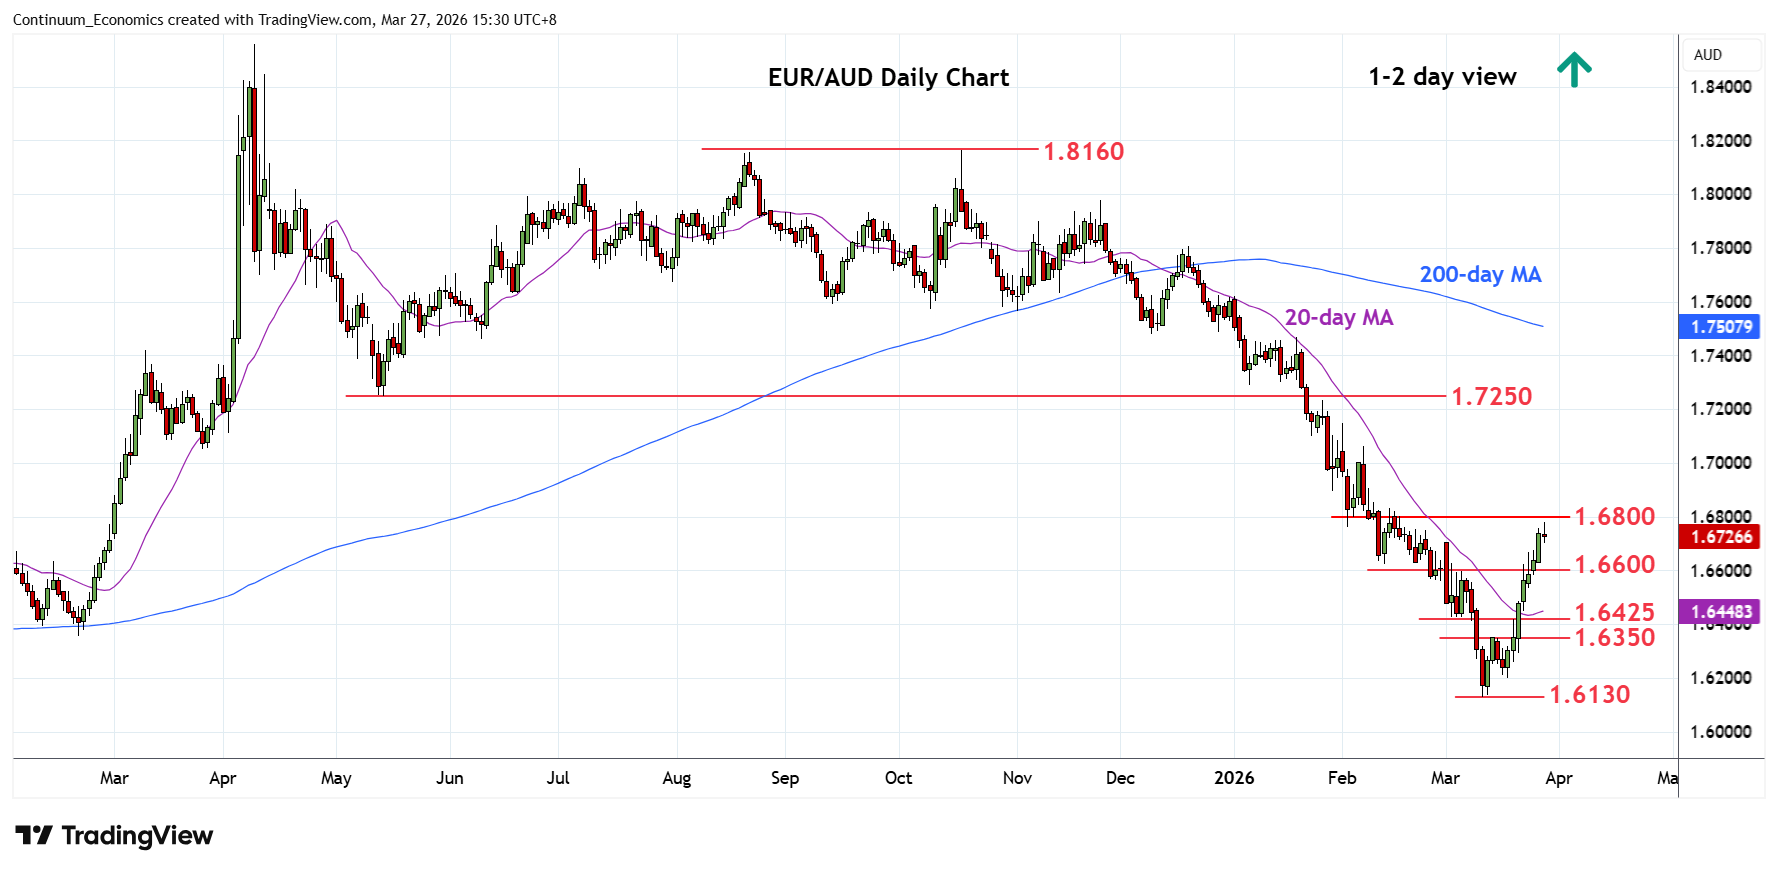
Chart EUR/AUD Update: Consolidating test of 1.6765/1.6800 resistance
1
Lower in consolidation following test of resistance at the 1.6765/1.6800 congestion
| Levels | Imp | Comment | Levels | Imp | Comment | |||
|---|---|---|---|---|---|---|---|---|
| R4 | 1.7145 | * | 50% Oct/Mar fall | S1 | 1.6620/00 | * | 12 Feb low, congestion | |
| R3 | 1.7000/50 | * | figure, congestion | S2 | 1.6500 | congestion | ||
| R2 | 1.6900/05 | ** | congestion, 38.2% | S3 | 1.6425 | * | 5 Mar low | |
| R1 | 1.6800 | * | congestion | S4 | 1.6350 | ** | 13 Mar high |
Asterisk denotes strength of level
07:40 GMT - Lower in consolidation following test of resistance at the 1.6765/1.6800 congestion as prices unwind the stretched intraday and daily studies. However, pressure remains on the upside and a later break here will see room to further retrace the October/March losses. Above the 1.6800 level will see scope for extension to 1.6905, 38.2% Fibonacci level. Meanwhile, support is raised to the 1.6620/00 area which is expected to underpin and sustain bounce from the March low. Break will ease the upside pressure and see room for deeper pullback to support at the 1.6500/1.6425 area.