Published: 2025-10-14T14:13:16.000Z
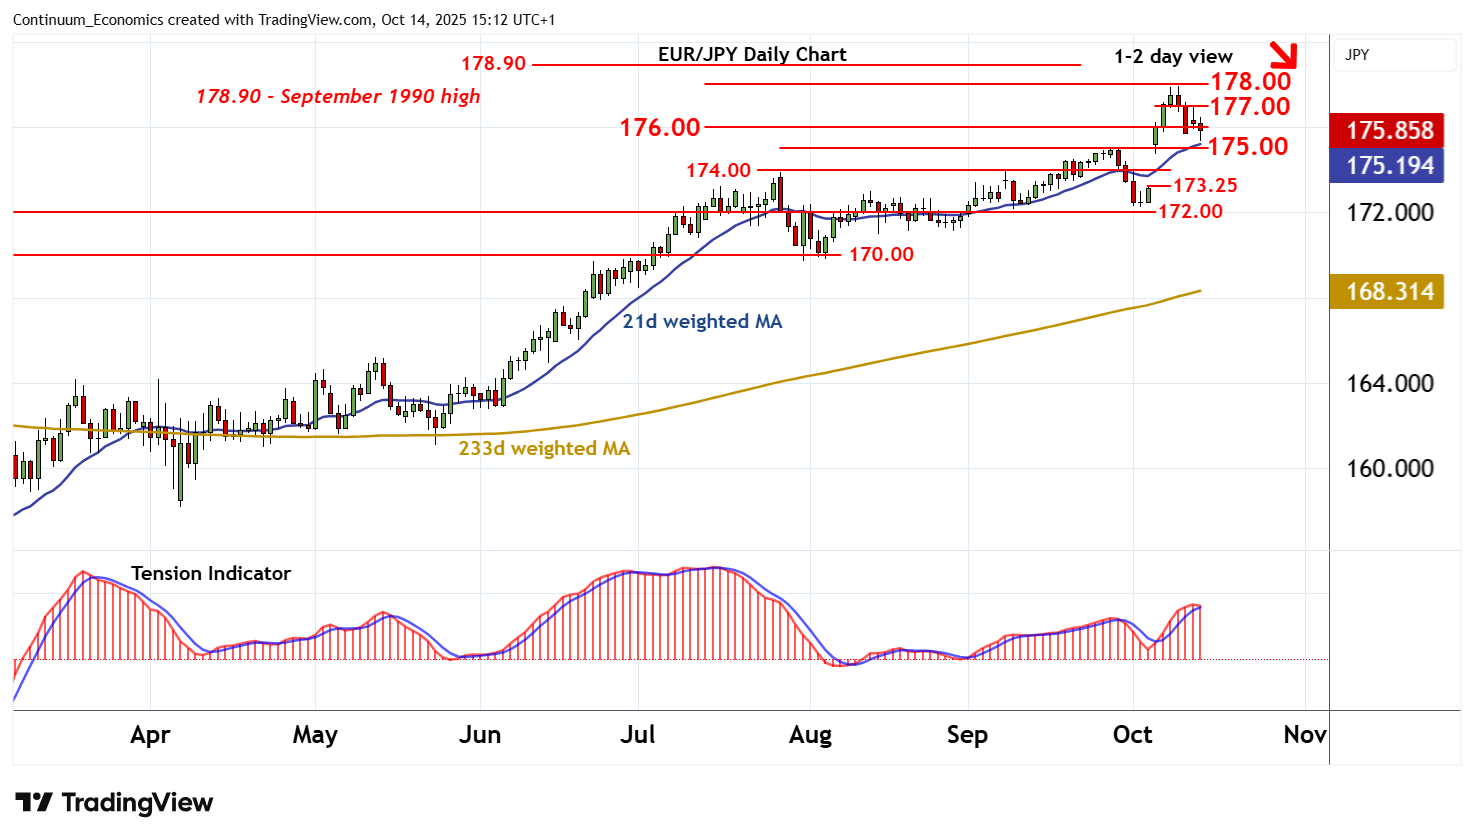
Chart EUR/JPY Update: Daily studies turning down
-
The test below 176.00 has bounced from 175.35
| Levels | Imp | Comment | Levels | Imp | Comment | |||
|---|---|---|---|---|---|---|---|---|
| R4 | 180.00 | ** | historic congestion | S1 | 176.00 | * | break level | |
| R3 | 178.90 | ** | Sep 1990 high | S2 | 175.00 | * | congestion | |
| R2 | 178.00 | ** | Jan 1991 (y) high | S3 | 174.00 | ** | congestion | |
| R1 | 177.00 | intraday break level | S4 | 173.25 | * | 3 Oct high, gap low |
Asterisk denotes strength of level
14:55 BST - The test below 176.00 has bounced from 175.35, as negative intraday studies flatten, with prices once again trading around 176.00. Daily readings are turning down and broader weekly charts coming under pressure, highlighting room for fresh losses in the coming sessions. A break back below 176.00 will open up congestion support at 175.00, with potential for continuation down to 174.00. Meanwhile, resistance remains at 177.00. A close above here would help to stabilise price action. But a further close above the 178.00 year high of January 1991 will improve sentiment and extend gains towards the 178.90 high of September 1990.