Published: 2025-05-27T03:30:46.000Z
Chart USD/IDR Updates: Consolidating test of 16169/16149 support

Technical Analyst
-
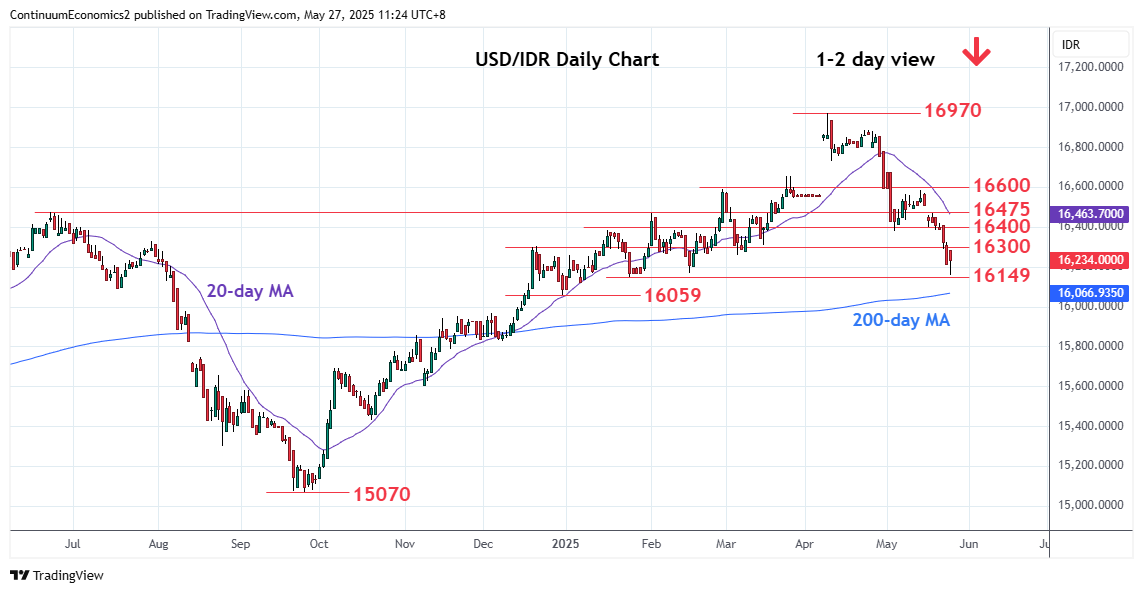
Prices remain under pressure to extend losses from the April YTD high at 16970 to reach support at the 16169/16149
| Levels | Imp | Comment | Levels | Imp | Comment | |||
|---|---|---|---|---|---|---|---|---|
| R4 | 16584/600 | ** | 14 May high, congestion | S1 | 16149 | * | 24 Jan low | |
| R3 | 16475 | * | Jun 2024 year high | S2 | 16124 | * | 7 Jan YTD low | |
| R2 | 16400 | * | congestion | S3 | 16059 | * | 31 Dec low | |
| R1 | 16300 | * | congestion | S4 | 16019 | * | 50% Sep/Apr rally |
Asterisk denotes strength of level
03:30 GMT - Prices remain under pressure to extend losses from the April YTD high at 16970 to reach support at the 16169/16149, February and 24 January lows. Consolidation here see prices unwinding oversold intraday studies but negative daily and weekly chart suggest room for further losses going forward. Below these will see room for deeper retracement of the September/April rally to retest 7 January YTD low at 16124. Lower still, will target the 16059 support and 16019, 50% Fibonacci level. Meanwhile, resistance is lowered to the 16300 congestion which is expected to cap.