Published: 2026-01-14T09:15:07.000Z
Chart USD Index DXY Update: Consolidating
1
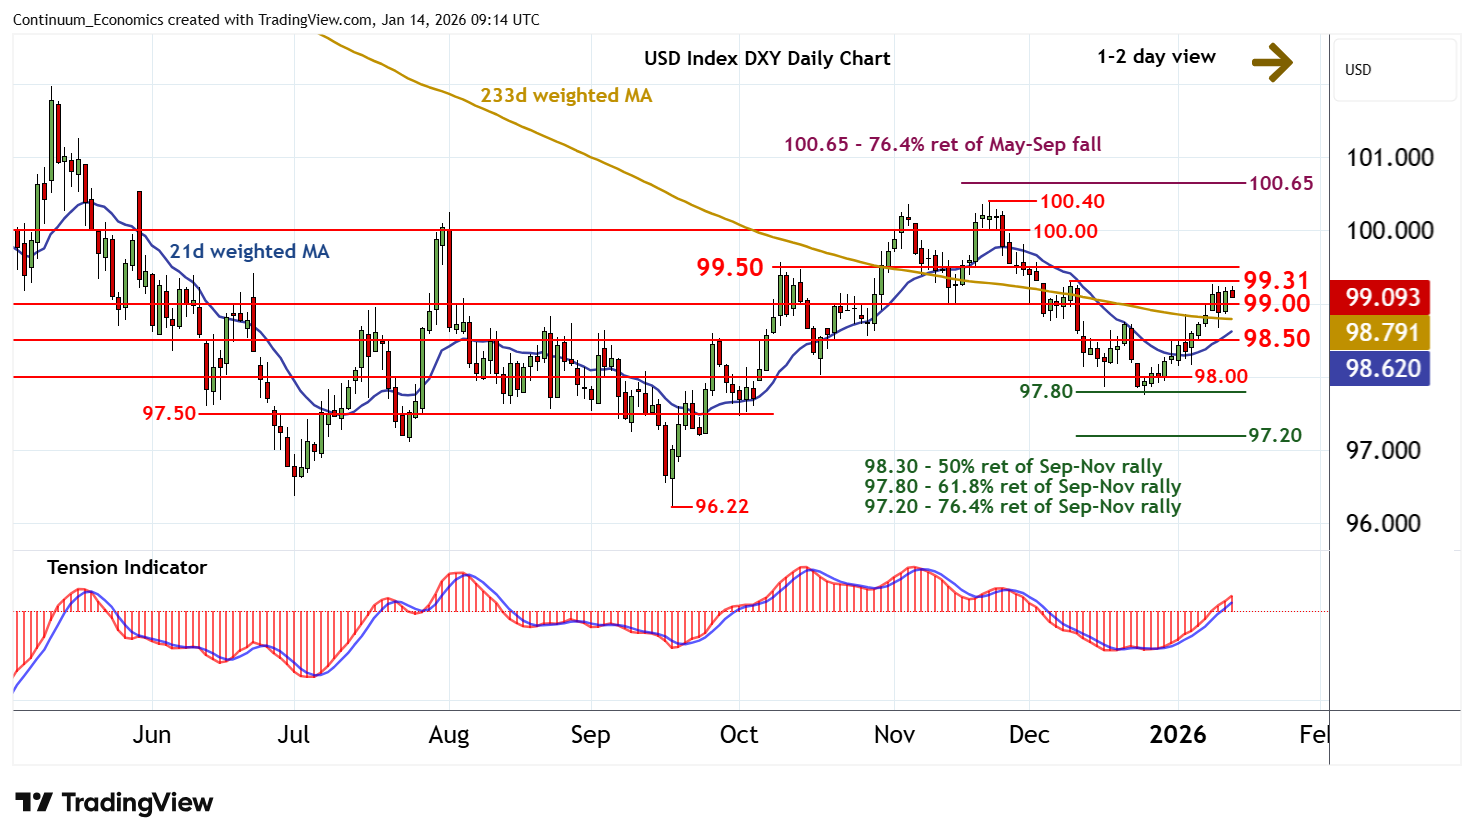
The anticipated break above 99.00 has met expected selling interest beneath strong resistance at 99.26/31
| Levels | Imp | Comment | Levels | Imp | Comment | |||
|---|---|---|---|---|---|---|---|---|
| R4 | 100.40 | ** | 21 Nov (m) high | S1 | 99.00 | * | congestion | |
| R3 | 100.00 | ** | congestion | S2 | 98.50 | * | congestion | |
| R2 | 99.50 | * | break level | S3 | 98.00 | * | congestion | |
| R1 | 99.26/31 | * | 9 Jan; 9 Dec (w) highs | S4 | 97.80 | ** | 61.8% ret of Sep-Nov rally |
Asterisk denotes strength of level
09:05 GMT - The anticipated break above 99.00 has met expected selling interest beneath strong resistance at 99.26/31, with prices currently trading around 99.10. Overbought daily stochastics are falling, suggesting room for a test of congestion support at 99.00. But the rising daily Tension Indicator and mixed/positive weekly charts are expected to prompt renewed buying interest around here. Meanwhile resistance is at 99.26/31 and extends to 99.50. A break above here, if seen, will improve sentiment and extend late-December gains towards strong resistance at congestion around 100.00.