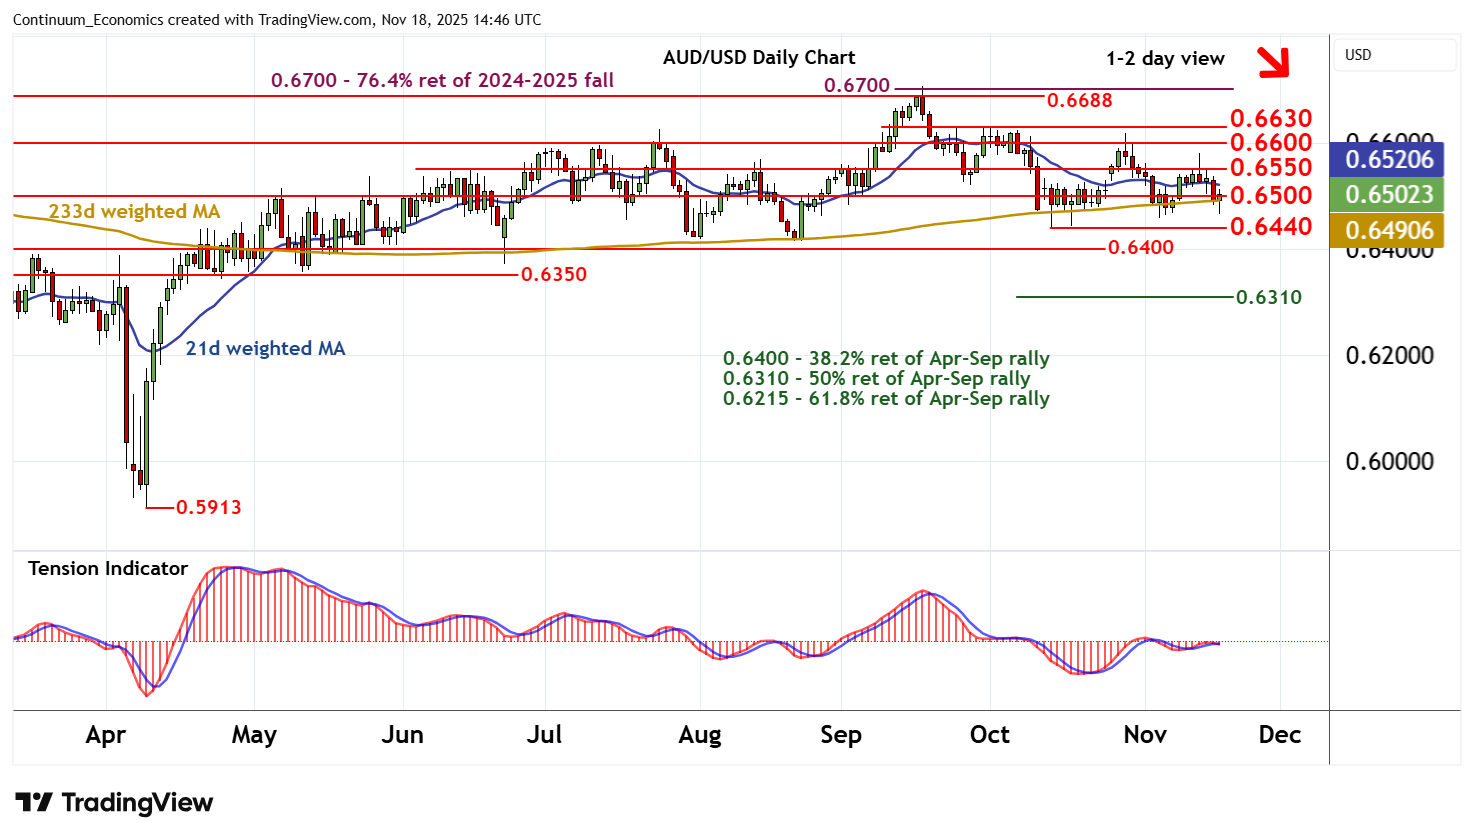
Chart AUD/USD Update: Leaning lower
The anticipated break below congestion support at 0.6500 has bounced from 0.6465
| Levels | Imp | Comment | Levels | Imp | Comment | |||
|---|---|---|---|---|---|---|---|---|
| R4 | 0.6688 | * | Nov 2024 (m) high | S1 | 0.6500 | * | congestion | |
| R3 | 0.6630 | * | break level | S2 | 0.6460~ | 5 Nov low | ||
| R2 | 0.6600 | ** | congestion | S3 | 0.6440 | ** | 14 Oct (m) low | |
| R1 | 0.6550 | * | congestion | S4 | 0.6400 | ** | congestion |
Asterisk denotes strength of level
14:35 GMT - The anticipated break below congestion support at 0.6500 has bounced from 0.6465, as oversold intraday studies unwind, with prices once again trading around 0.6500. Daily readings continue to track lower and broader weekly charts are also under pressure, pointing to room for fresh tests lower. However, a close below the 0.6440 monthly low of 14 October is needed to turn sentiment negative and extend mid-September losses initially to congestion around 0.6400. Meanwhile, resistance remains at congestion around 0.6550. A close above here, if seen, will help to stabilise price action and prompt consolidation beneath further congestion around 0.6600.