Published: 2025-02-18T11:44:31.000Z
Chart USD/ZAR Update: Consolidating - background studies under pressure

Senior Technical Strategist
-
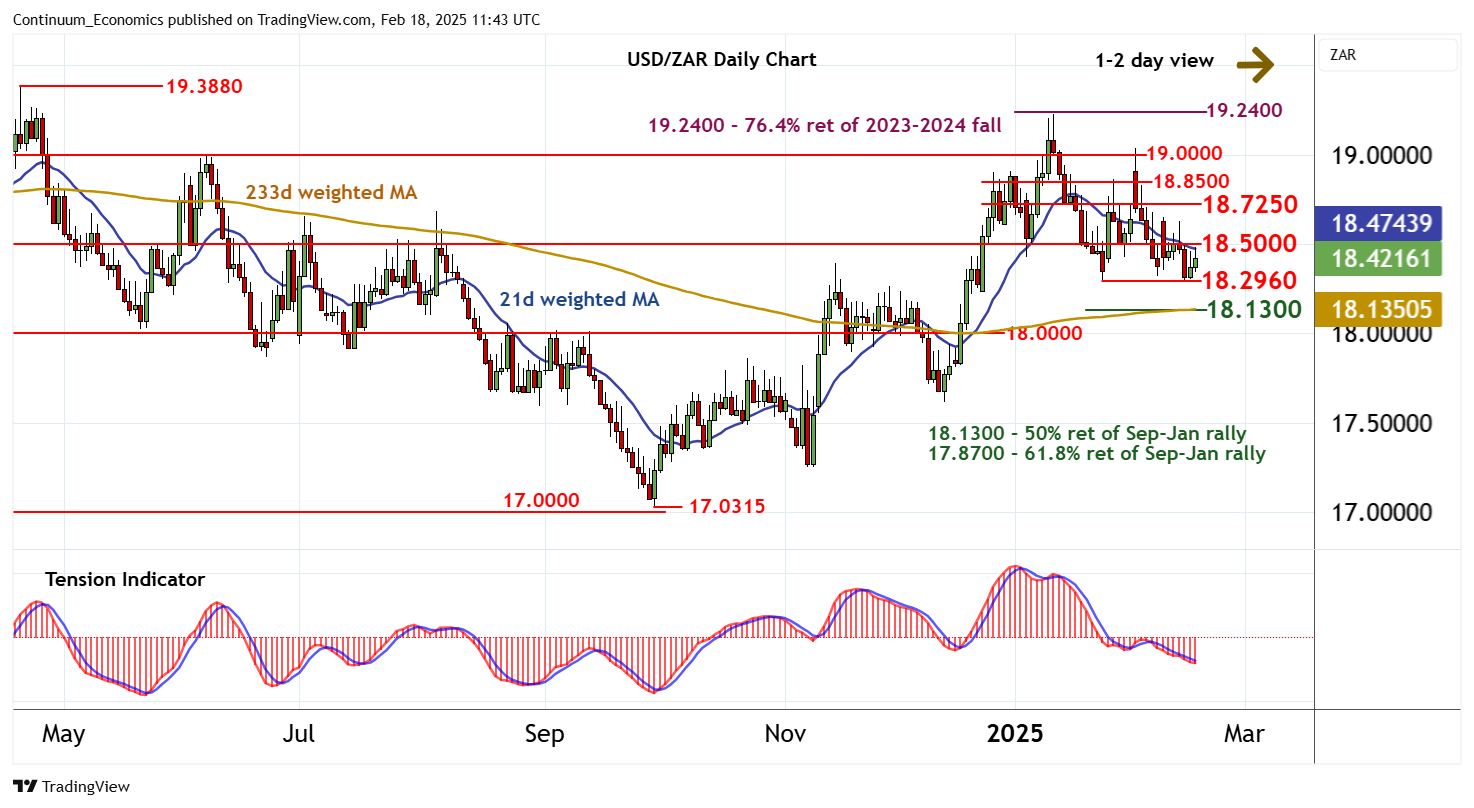
Little change, as prices extend cautious trade within the 18.2960 - 18.5000 area
| Level | Comment | Level | Comment | |||||
|---|---|---|---|---|---|---|---|---|
| R4 | 19.0000 | ** | congestion | S1 | 18.2960 | * | 24 Jan YTD low | |
| R3 | 18.8500 | break level | S2 | 18.1300 | * | 50% ret of Sep-Jan rally | ||
| R2 | 18.7250 | * | congestion | S3 | 18.0000 | ** | congestion | |
| R1 | 18.5000 | ** | break level | S4 | 17.8700 | ** | 61.8% ret of Sep-Jan rally |
Asterisk denotes strength of level
11:20 GMT - Little change, as prices extend cautious trade within the 18.2960 - 18.5000 area. Immediate focus is on resistance at the 18.5000 break level, but mixed intraday studies and mixed/negative daily readings are expected to limit any tests above here in renewed selling interest beneath congestion resistance at 18.7250. Following cautious trade, negative weekly charts point to fresh losses. But a close below the 18.2960 current year low of 24 January is needed to add weight to sentiment and extend January losses initially to the 18.1300 Fibonacci retracement.