Published: 2025-12-10T00:32:36.000Z
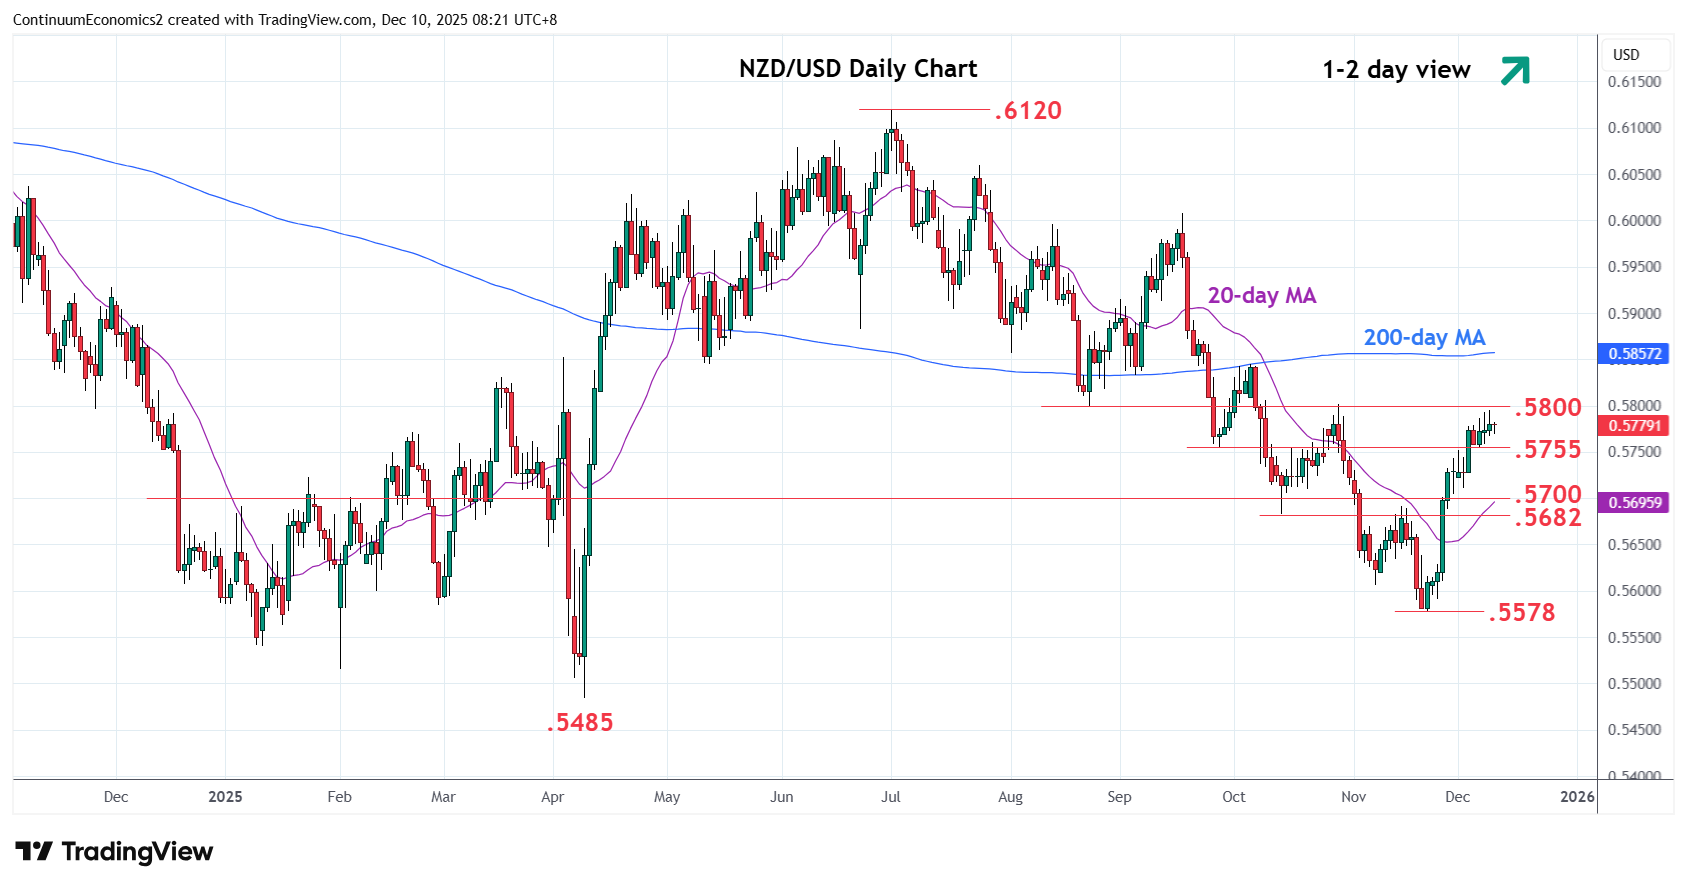
Chart NZD/USD Update: Consolidating test of .5785/.5800 resistance
1
Little change, as prices consolidate test of the .5785/.5800, 38.2% Fibonacci level and congestion area
| Levels | Imp | Comment | Levels | Imp | Comment | |||
|---|---|---|---|---|---|---|---|---|
| R4 | .5900/10 | * | congestion, 61.8% | S1 | .5755/50 | * | Aug low, congestion | |
| R3 | .5850/55 | ** | 50%, 1 Aug low | S2 | .5700/.5682 | ** | congestion, Oct low | |
| R2 | .5800 | ** | 22 Aug low | S3 | .5650 | * | congestion | |
| R1 | .5785 | * | 38.2% Jul/Nov fall | S4 | .5606 | * | 7 Nov low |
Asterisk denotes strength of level
00:30 GMT - Little change, as prices consolidate test of the .5785/.5800, 38.2% Fibonacci level and congestion area. However, pressure remains on the upside though the overbought intraday and daily studies keeping gains in check and suggest room for minor corrective pullback. Clearance will further retrace the July/November losses and see room for extension to strong resistance at the .5850/.5855 area. Meanwhile, support is raised to the .5755/50, August low and congestion area. Below here will delay bulls and see room for deeper pullback to strong support at the .5700/.5682 area.