Chart USD/CAD Update: Choppy trade - gains to remain limited

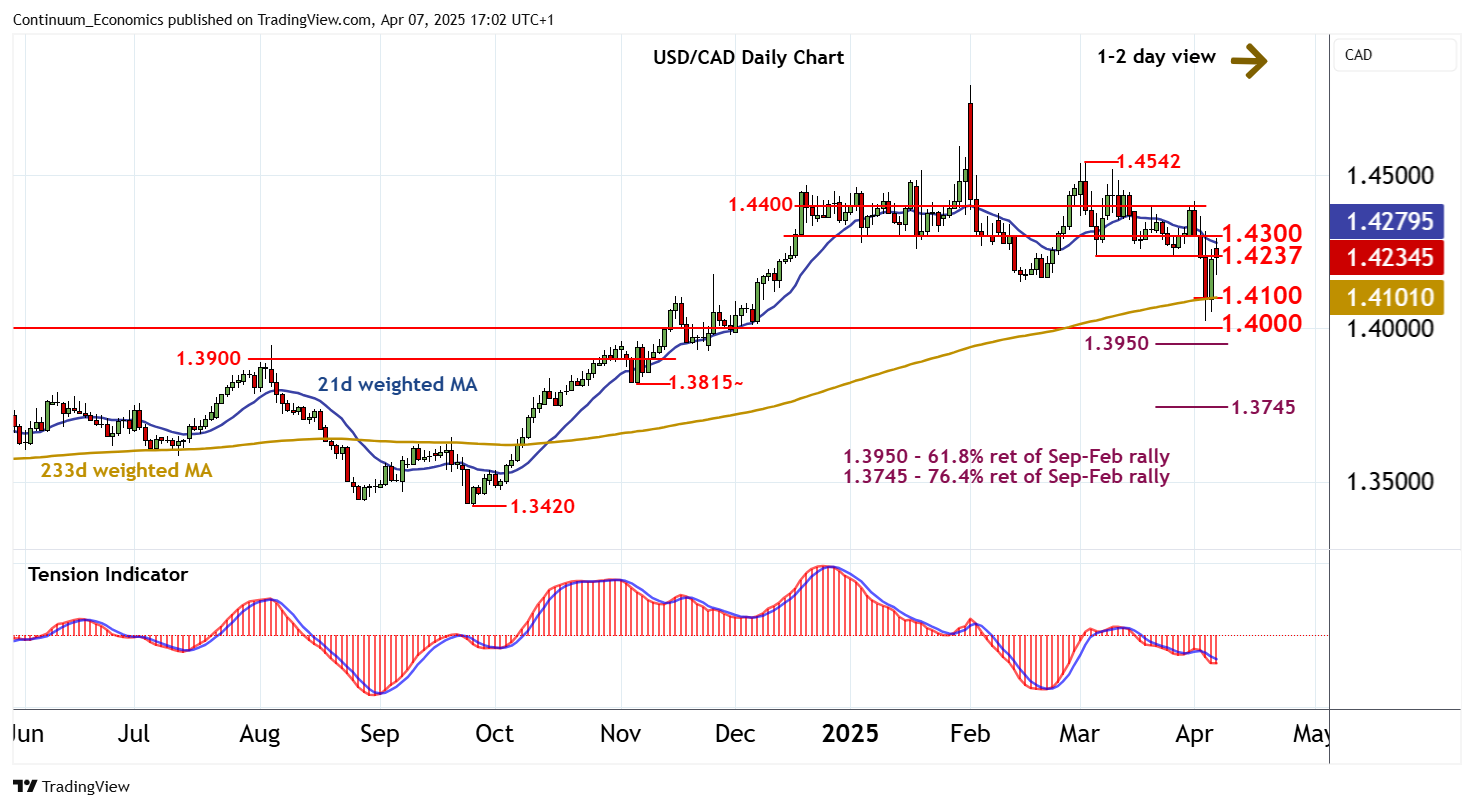
The test into the broad 1.4237 - 1.4300 resistance range is giving way to a fresh pullback as overbought intraday studies unwind
| Levels | Imp | Comment | Levels | Imp | Comment | |||
|---|---|---|---|---|---|---|---|---|
| R4 | 1.4450 | * | range highs | S1 | 1.4100 | break level | ||
| R3 | 1.4400 | * | break level | S2 | 1.4025 | * | 3 Apr YTD low | |
| R2 | 1.4300 | * | break level | S3 | 1.4000 | * | break level | |
| R1 | 1.4237 | * | 6 Mar (m) low | S4 | 1.3950 | ** | 61.8% ret of Sep-Feb rally |
Asterisk denotes strength of level
16:50 BST - The test into the broad 1.4237 - 1.4300 resistance range is giving way to a fresh pullback as overbought intraday studies unwind, with prices currently trading around 1.4210. Negative daily readings have turned mixed. suggesting a minor improvement in sentiment and room for a fresh test higher. But negative weekly charts should limit any break above 1.4300 in renewed selling interest towards 1.4400. Meanwhile, support is down to the 1.4100 break level. A later close beneath here will add weight to sentiment and open up a test of support at the 1.4000 break level and the 1.3950 Fibonacci retracement.