Continuum Economics
  • Search
  • About Us
  • Buy
  • Invite A Friend
  • My Basket
  • Articles
  • Calendar
  • Forecasts
  • Events
  • Data
  • Newsletters
  • My Alerts
  • Community
  • Directory
  • About Us
  • Buy
  • Invite A Friend
  • My Basket
  • Articles
    • All
    • Thematic
    • Tactical
    • Asia
    • EMEA
    • Americas
    • Newsletters
    • Freemium
    • Editor's Choice
    • Most Viewed
    • Most Shared
    • Most Liked
  • Calendar
    • Interactive
      • China
      • United States
      • Eurozone
      • United Kingdom
    • Month Ahead
    • Reviews
    • Previews
  • Forecasts
    • Forecasts
    • Key Views
  • Events
    • Media
    • Conference Calls
  • Data
    • Country Insights
    • Shadow Credit Ratings
    • Full CI Data Download
  • Newsletters
  • My Alerts
  • Community
    • FX
    • Fixed Income
    • Macro Strategy
    • Credit Markets
    • Equities
    • Commodities
    • Precious Metals
    • Renewables
  • Directory
  • My Account
  • Notifications Setup
  • Administration Panel
  • Account Details
  • Recent Devices
  • Distribution Lists
  • Shared Free Trials
  • Saved Articles
  • Shared Alerts
  • My Posts
Published: 2025-09-09T06:57:30.000Z

Chartbook: US Chart Gold (XAU): Extending break of May-August ascending triangle

byPakLai Ng

Technical Analyst
1

Extended choppy trade below the 3440 resistance through the May-August period to trace out an ascending triangle

Extended choppy trade below the 3440 resistance through the May-August period to trace out an ascending triangle. Subsequent breakout here  in late-August and follow-through above the April high at 3500 see prices reaching fresh record high above 3600 level.

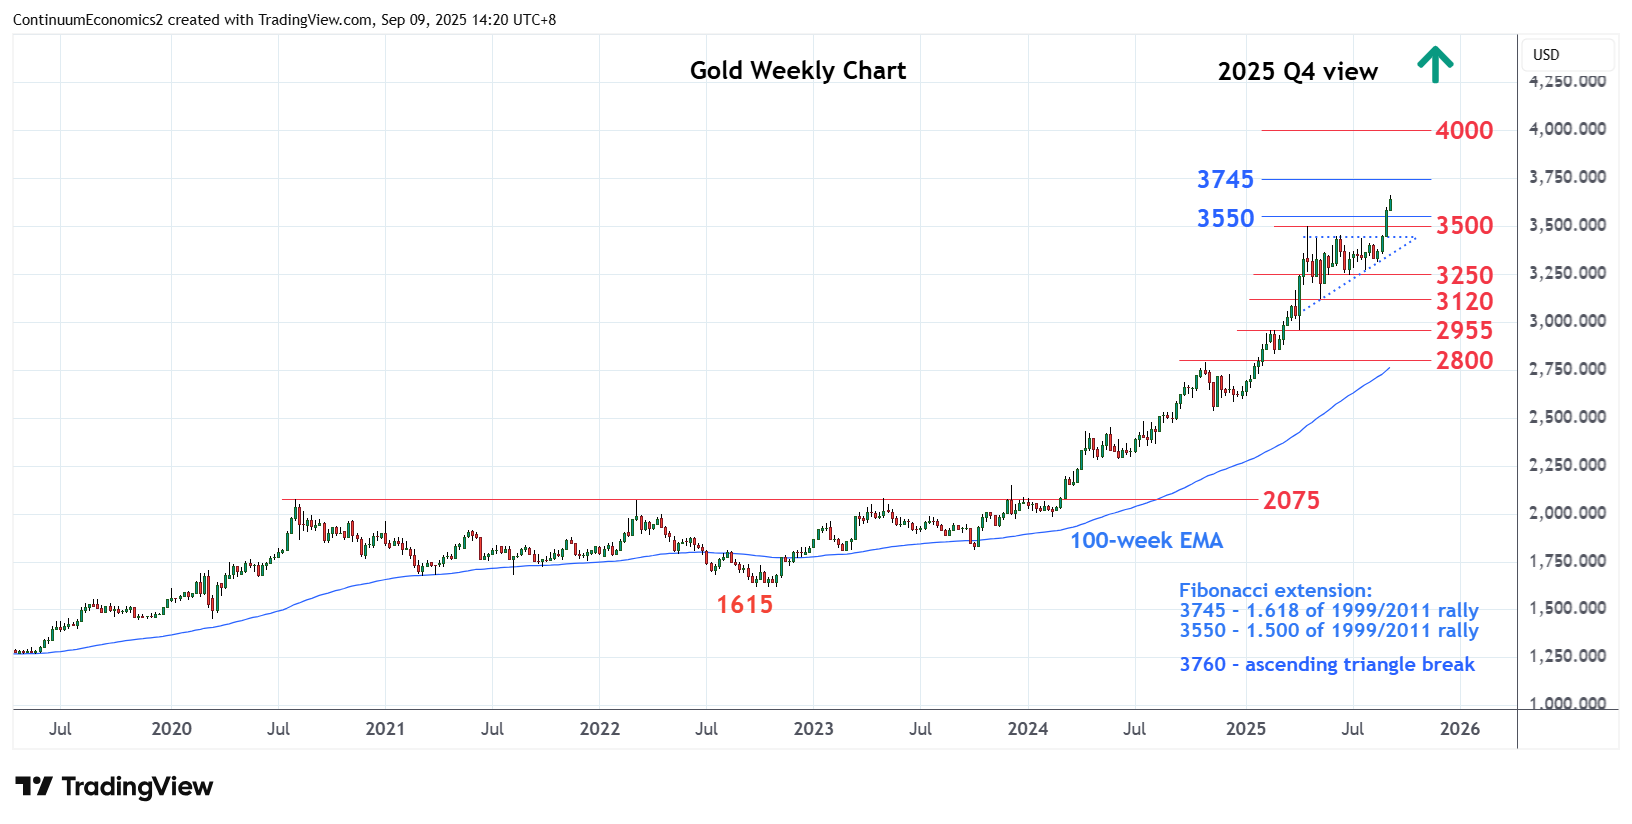
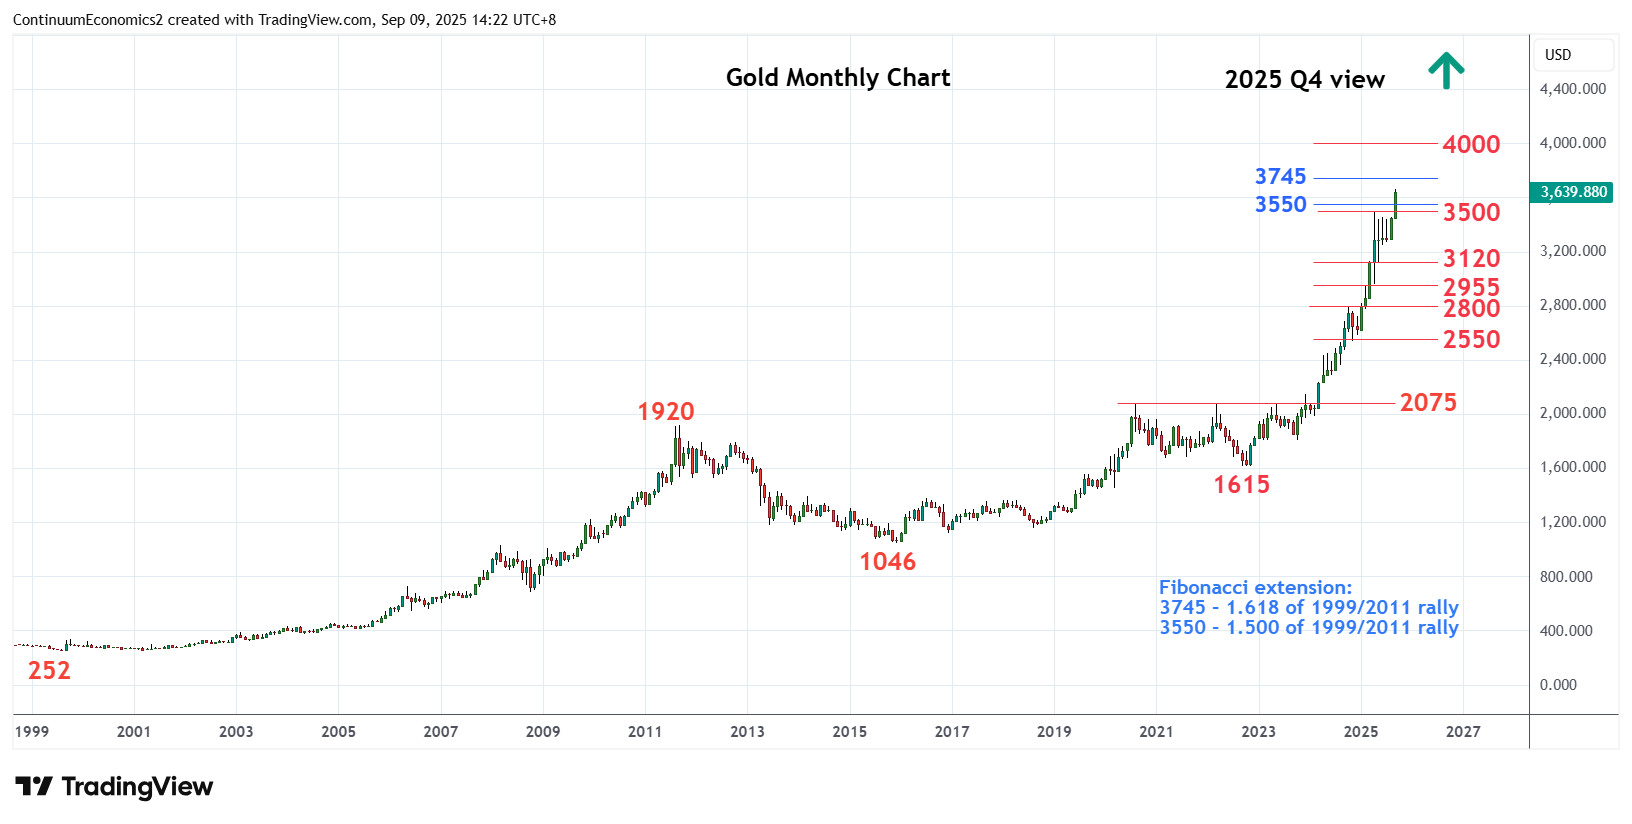
Bullish price action highlights potential for further gains to target 3745, 1.618 Fibonacci extension of the 1999/2011 rally measured from 2015 low. Higher still, will see ascending triangle break objective at 3760. Beyond this will see room for extension to the 3800 level. Clearance here, if seen, will then turn focus to the 4000 psychological level.

However, steep gains from the 2022 year low see weekly and monthly charts pushing deep into overbought areas and caution corrective pullback. Meanwhile, support is raised to the 3500/3440, April and May highs. Below this will open up room for deeper correction to support at the 3250 and 3120, June and May corrective lows.

Continue to read the article for free
Login

or

or

Topics
Gold-TA
Technical Analysis
ChartBook

GENERAL

  • Home
  • About Us
  • Our Team
  • Careers

LEGAL

  • Terms and Conditions
  • Privacy Policy
  • Compliance
  • GDPR

GET IN TOUCH

  • Contact Us
Continuum Economics
The Technical Analyst Awards Winner 2021
The Technical Analyst Awards Finalist 2020
image