Published: 2025-10-15T00:36:55.000Z
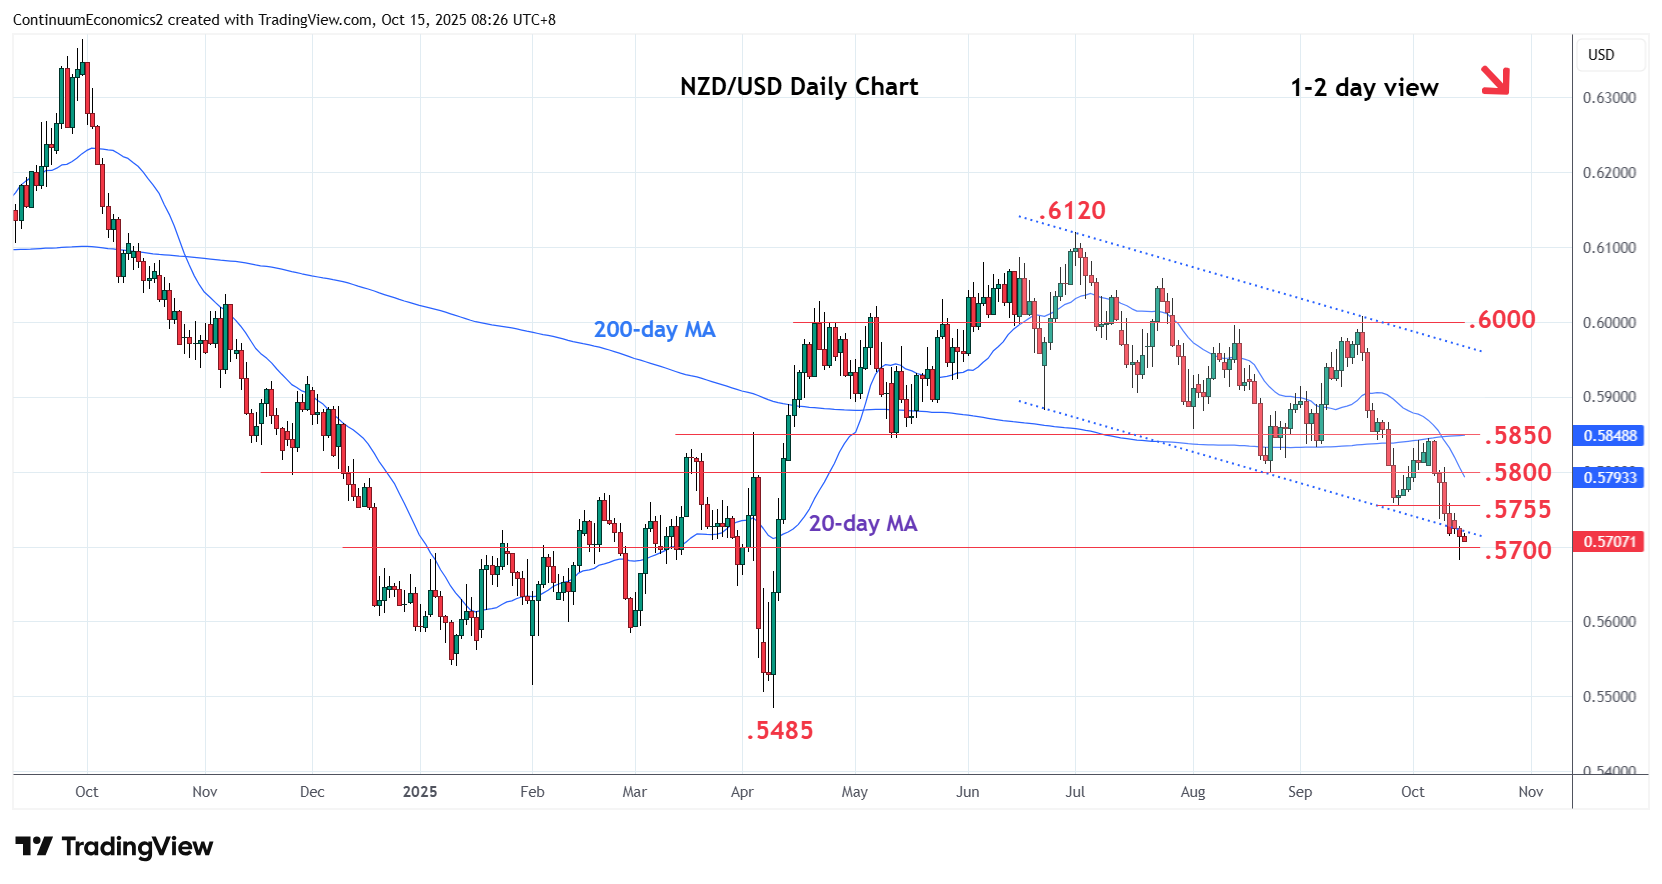
Chart NZD/USD Update: Consolidating above .5700, but downside still vulnerable
1
No follow-through on break of the .5700 level as prices turned up from the .5683 low to consolidate losses from the .5845, 6 October high
| Levels | Imp | Comment | Levels | Imp | Comment | |||
|---|---|---|---|---|---|---|---|---|
| R4 | .5900 | * | congestion | S1 | .5700 | * | congestion | |
| R3 | .5845/50 | ** | 6 Oct high, congestion | S2 | .5650 | * | congestion | |
| R2 | .5800 | * | Aug low | S3 | .5635 | * | 76.4% Apr/Jul rally | |
| R1 | .5755 | * | Sep low | S4 | .5600 | * | congestion |
Asterisk denotes strength of level
00:30 GMT - No follow-through on break of the .5700 level as prices turned up from the .5683 low to consolidate losses from the .5845, 6 October high. Intraday studies are stretched but bearish momentum keep pressure on the downside. Below the .5700 level will see room for extension to support at the .5650/.5635 congestion and 76.4% Fibonacci level. Meanwhile, resistance at the .5755 September low is expected to cap. Regaining this, will ease the downside pressure and see room for stronger bounce to the .5800/45 resistance.