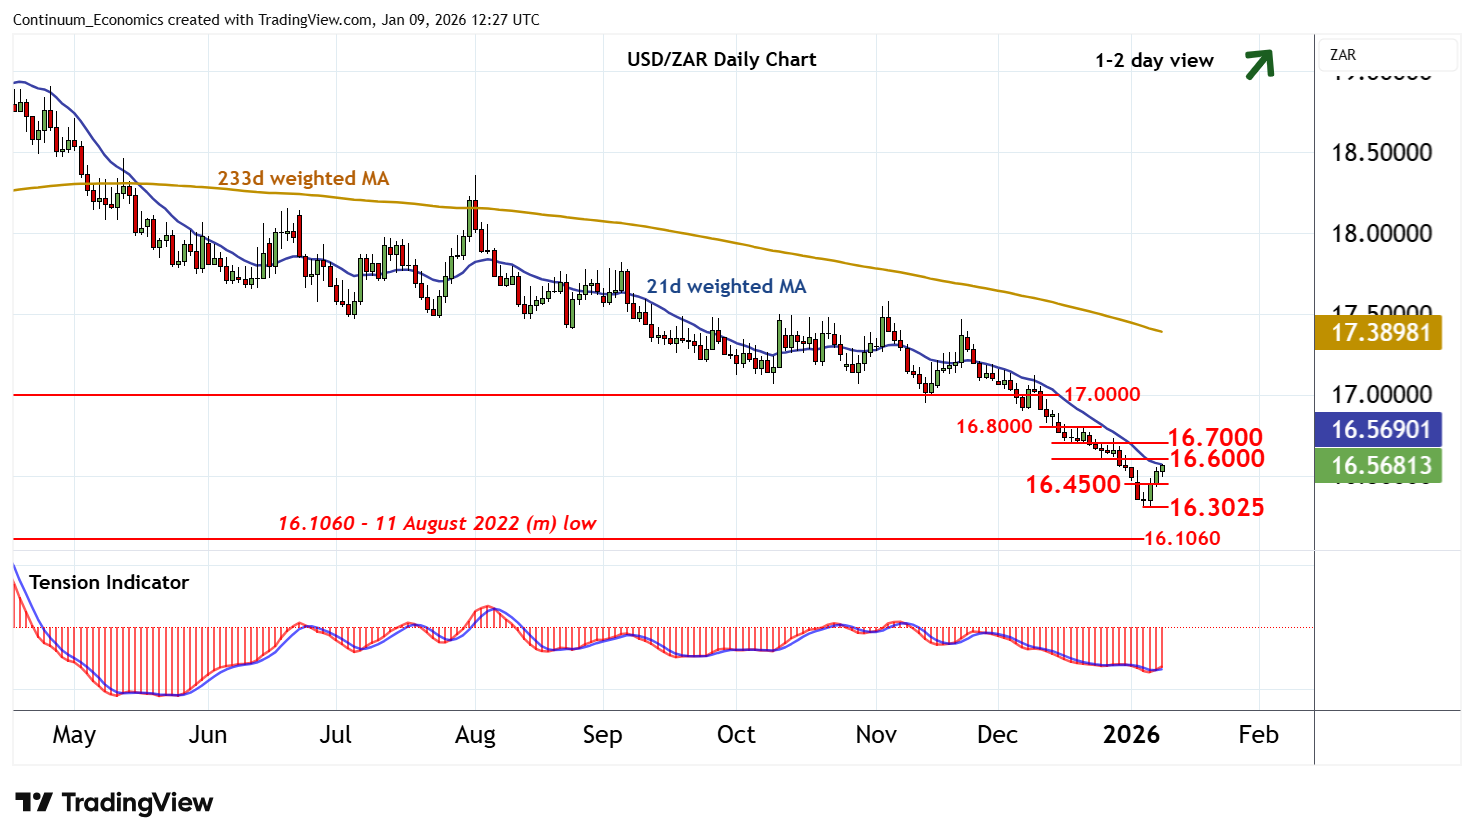
Chart USD/ZAR Update: Approaching 16.6000
Minor gains are extending, as daily readings continue to rise, with focus now on resistance at 16.6000
| Level | Comment | Level | Comment | |||||
|---|---|---|---|---|---|---|---|---|
| R4 | 17.0000 | ** | congestion | S1 | 16.4500 | break level | ||
| R3 | 16.8000 | break level | S2 | 16.3025 | * | 6 Jan YTD low | ||
| R2 | 16.7000 | break level | S3 | 16.1060 | ** | 11 Aug 2022 (m) low | ||
| R1 | 16.6000 | break level | S4 | 16.0000 | ** | congestion |
Asterisk denotes strength of level
12:10 GMT - Minor gains are extending, as daily readings continue to rise, with focus now on resistance at 16.6000. A break will open up 16.7000. But mixed/negative weekly charts are expected to limit any further extension beyond here in renewed selling interest/consolidation beneath 16.8000. Following cautious/corrective trade, fresh losses are looked for. Meanwhile, support is raised to 16.4500. However, a close below the 16.3025 current year low of 6 January will add weight to sentiment and extend the April bear trend towards the 16.1060 monthly low of 11 August 2022 and historic congestion around 16.0000. Just lower is the 15.8800 Fibonacci retracement. But flat oversold weekly stochastics are expected to limit any initial tests of this broad 15.8800 - 16.1060 range in short-covering/consolidation.