Chart USD/JPY Update: Leaning lower
Little change, as negative intraday studies keep near-term sentiment under pressure
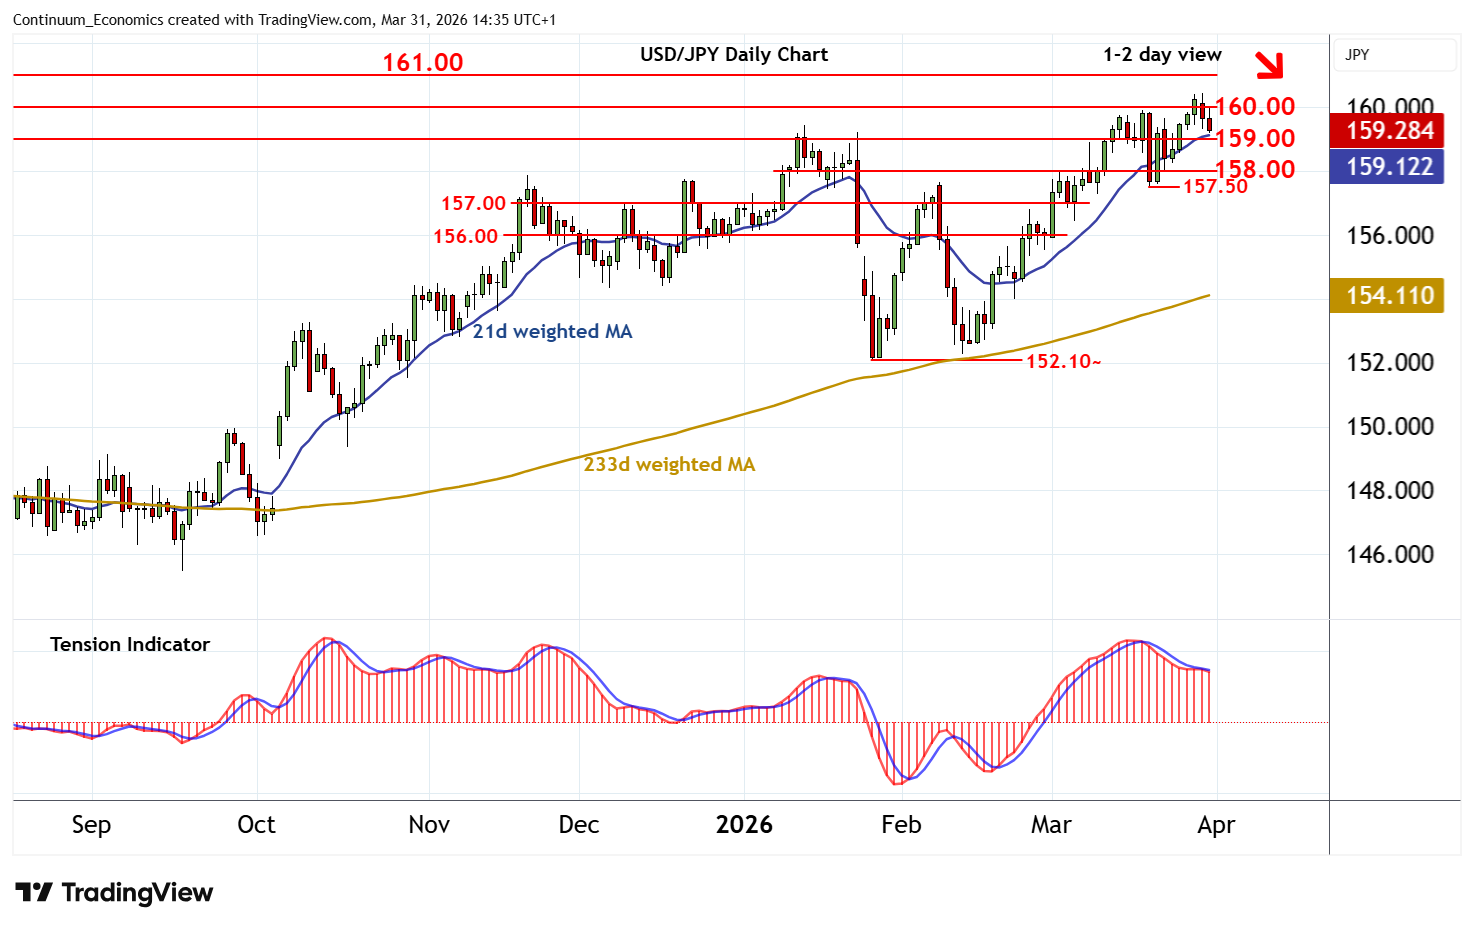
| Levels | Imp | Comment | Levels | Imp | Comment | |||
|---|---|---|---|---|---|---|---|---|
| R4 | 161.95 | ** | July 2024 (y) high | S1 | 159.00 | * | congestion | |
| R3 | 161.00 | July 2024 congestion | S2 | 158.00 | * | break level | ||
| R2 | 160.45 | ** | 30 Mar YTD high | S3 | 157.50 | * | 19 Mar (w) low | |
| R1 | 160.00 | ** | historic congestion | S4 | 157.00 | congestion |
Asterisk denotes strength of level
14:10 BST - Little change, as negative intraday studies keep near-term sentiment under pressure and extend losses towards congestion support at 159.00. Initial tests could give way to consolidation, as intraday studies become oversold, before deteriorating daily readings prompt further losses. A later break beneath here will open up support at 158.00, where mixed weekly charts could prompt fresh consolidation. Meanwhile, a close back above 160.00 will help to stabilise price action. But a further close above the 160.45 current year high of 30 March will improve price action and extend September 2024 gains towards July 2024 congestion around 161.00.