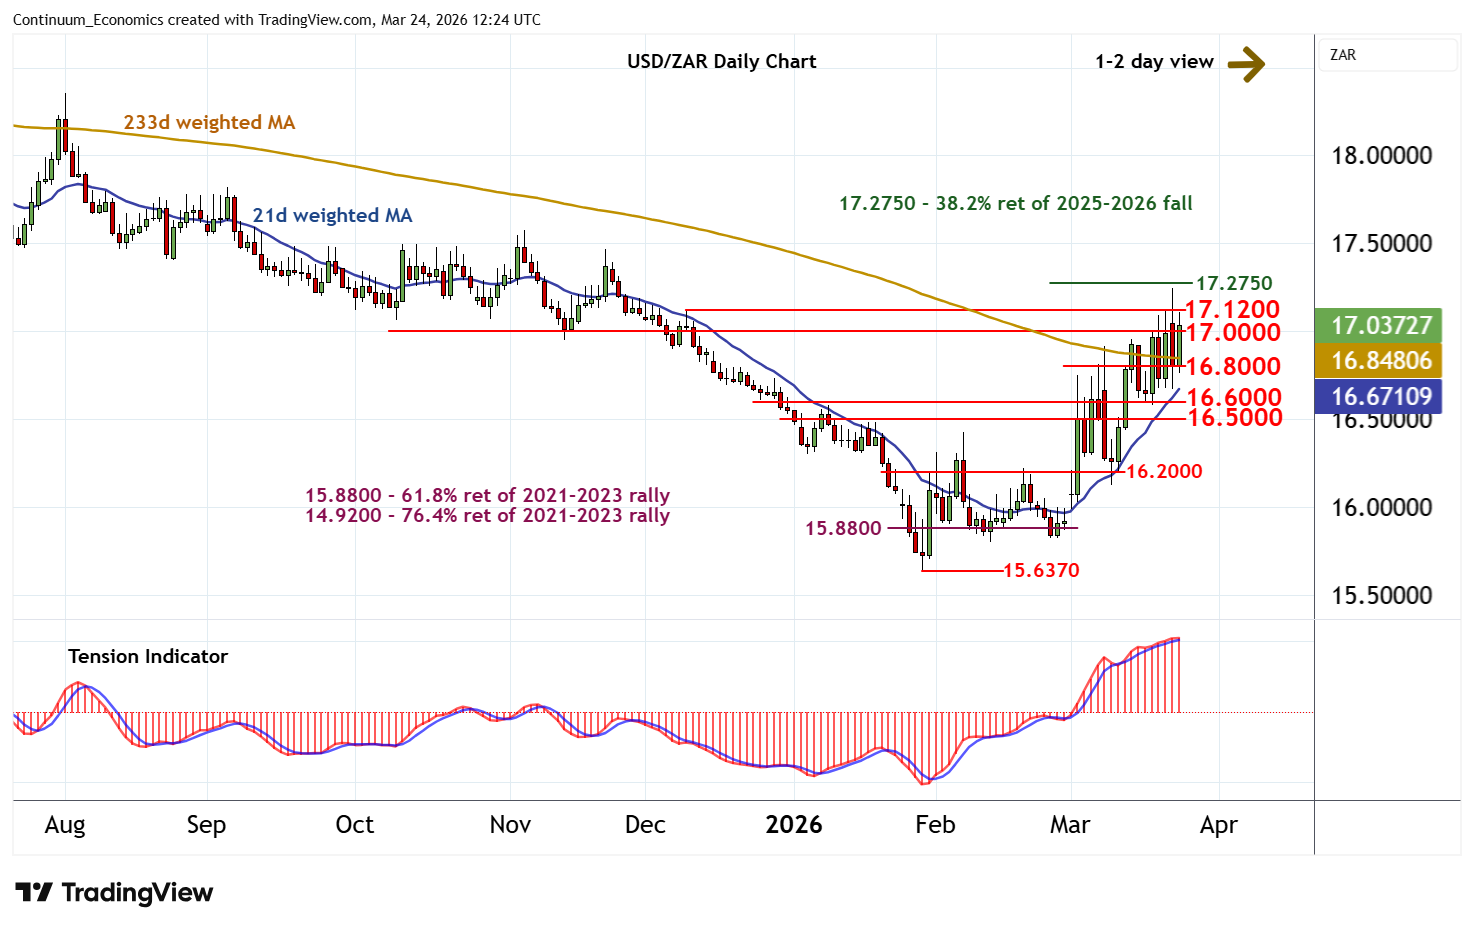
Chart USD/ZAR Update: Choppy in range
Choppy trade around congestion support at 16.8000 is giving way to fresh tests higher
| Level | Comment | Level | Comment | |||||
|---|---|---|---|---|---|---|---|---|
| R4 | 17.5000 | ** | break level | S1 | 16.8000 | congestion | ||
| R3 | 17.2750 | ** | 38.2% ret of 2025-2026 fall | S2 | 16.6000 | break level | ||
| R2 | 17.1200 | * | 9 Dec (w) high | S3 | 16.5000 | break level | ||
| R1 | 17.0000 | * | congestion | S4 | 16.2000 | * | congestion |
Asterisk denotes strength of level
12:00 GMT - Choppy trade around congestion support at 16.8000 is giving way to fresh tests higher, with prices currently pressuring resistance within the 17.0000 - 17.1200 range. The positive daily Tension Indicator is flattening, suggesting further consolidation within here, before a tick higher in daily stochastics and positive weekly charts prompt further gains. A break above 17.0000 - 17.1200 will extend late-January gains towards the 17.2750 Fibonacci retracement. But flat overbought weekly stochastics could limit any initial tests in profit-taking/consolidation. Meanwhile, a break below 16.8000 should be limited in consolidation within the 16.5000 - 16.6000 range.