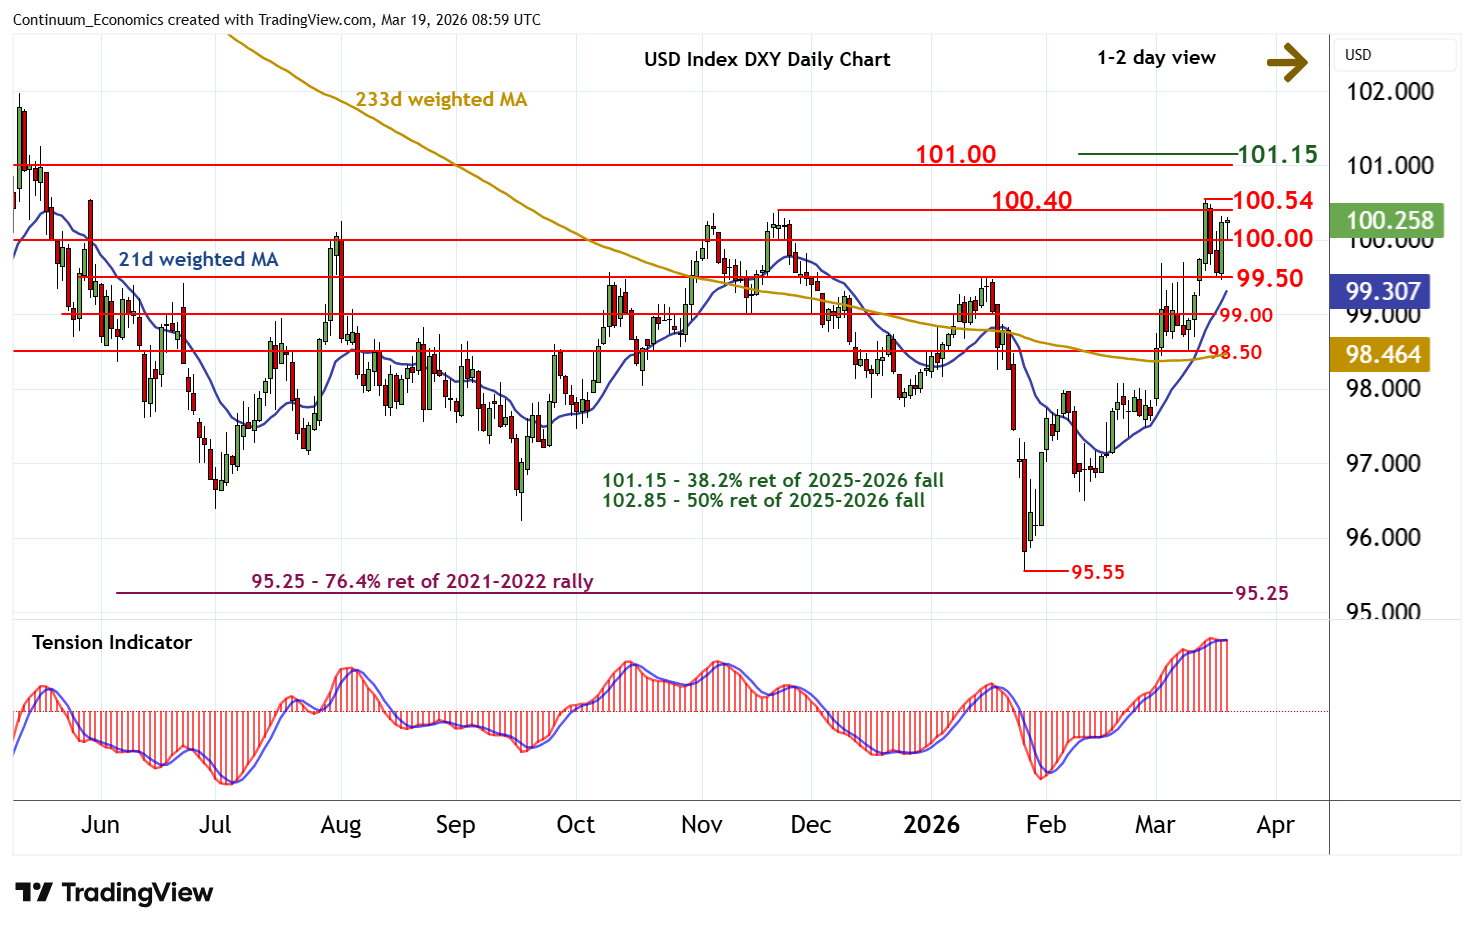
Chart USD Index DXY Update: Sharp bounce towards year highs
Consolidation above congestion support at 99.50 has given way to a fresh bounce
| Levels | Imp | Comment | Levels | Imp | Comment | |||
|---|---|---|---|---|---|---|---|---|
| R4 | 101.98 | * | 12 May 2025 (m) high | S1 | 100.00 | ** | congestion | |
| R3 | 101.15 | ** | 38.2% ret of 2025-2026 fall | S2 | 99.50 | * | congestion | |
| R2 | 101.00 | * | congestion | S3 | 99.00 | ** | congestion | |
| R1 | 100.40/54 | ** | 21 Nov (m); 13 Mar YTD highs | S4 | 98.50 | * | congestion |
Asterisk denotes strength of level
08:45 GMT - Consolidation above congestion support at 99.50 has given way to a fresh bounce, with the break above 100.00 improving sentiment and giving way to consolidation within 100.00/30. Focus is on critical resistance within the 100.40 monthly high of 21 November and the 100.54 current year high of 13 March. But mixed/negative daily readings should limit any initial tests in fresh consolidation, before rising weekly charts prompt further gains. A close above here will turn sentiment positive and confirm continuation of late-January gains, initially towards resistance at congestion around 101.00 and the 101.15 multi-month Fibonacci retracement. Meanwhile, any immediate tests below congestion support at 100.00 should give way to fresh consolidation above 99.50.