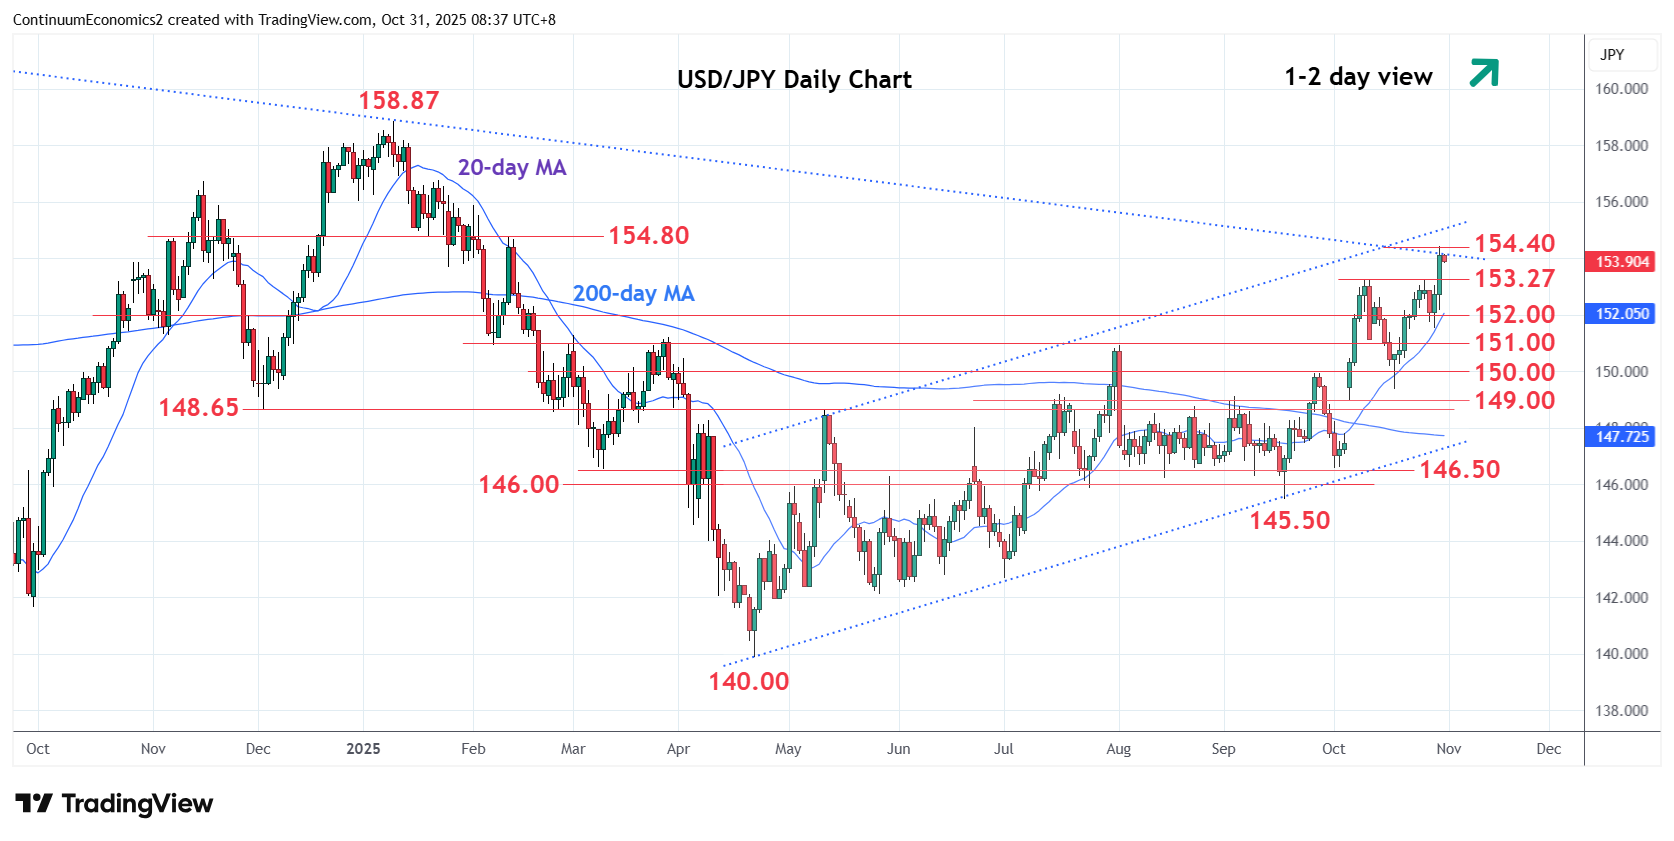
Chart USD/JPY Update: Consolidating at 154.40, 76.4% Fibonacci level
Break above the 153.27 resistance has seen rally to reach the 154.40, 76.4% Fibonacci level as well as trendline from the 2024 year high
| Levels | Imp | Comment | Levels | Imp | Comment | |||
|---|---|---|---|---|---|---|---|---|
| R4 | 156.00 | * | congestion | S1 | 153.27/00 | ** | 10 Oct high, congestion | |
| R3 | 155.00 | * | congestion | S2 | 152.00 | * | congestion | |
| R2 | 154.80 | * | 12 Feb high | S3 | 151.50 | * | congestion | |
| R1 | 154.45 | ** | 30 Oct high | S4 | 150.92 | ** | Aug high |
Asterisk denotes strength of level
00:50 GMT - Break above the 153.27 resistance has seen rally to reach the 154.40, 76.4% Fibonacci level as well as trendline from the 2024 year high. Positive daily and weekly studies suggest scope for further gains within the bullish channel from the 140.00 April current year low to further retrace the January/April losses. Higher will see room to the resistance at the 154.80/155.00 congestion. However, overbought daily studies caution corrective pullback. Would take break of the 153.27/153.00 area to open up room for deeper pullback to retrace gains from the 145.50, September low and channel support.