Published: 2026-02-23T02:06:40.000Z
Chart GBP/USD Update: Extend bounce from 200-day MA
1
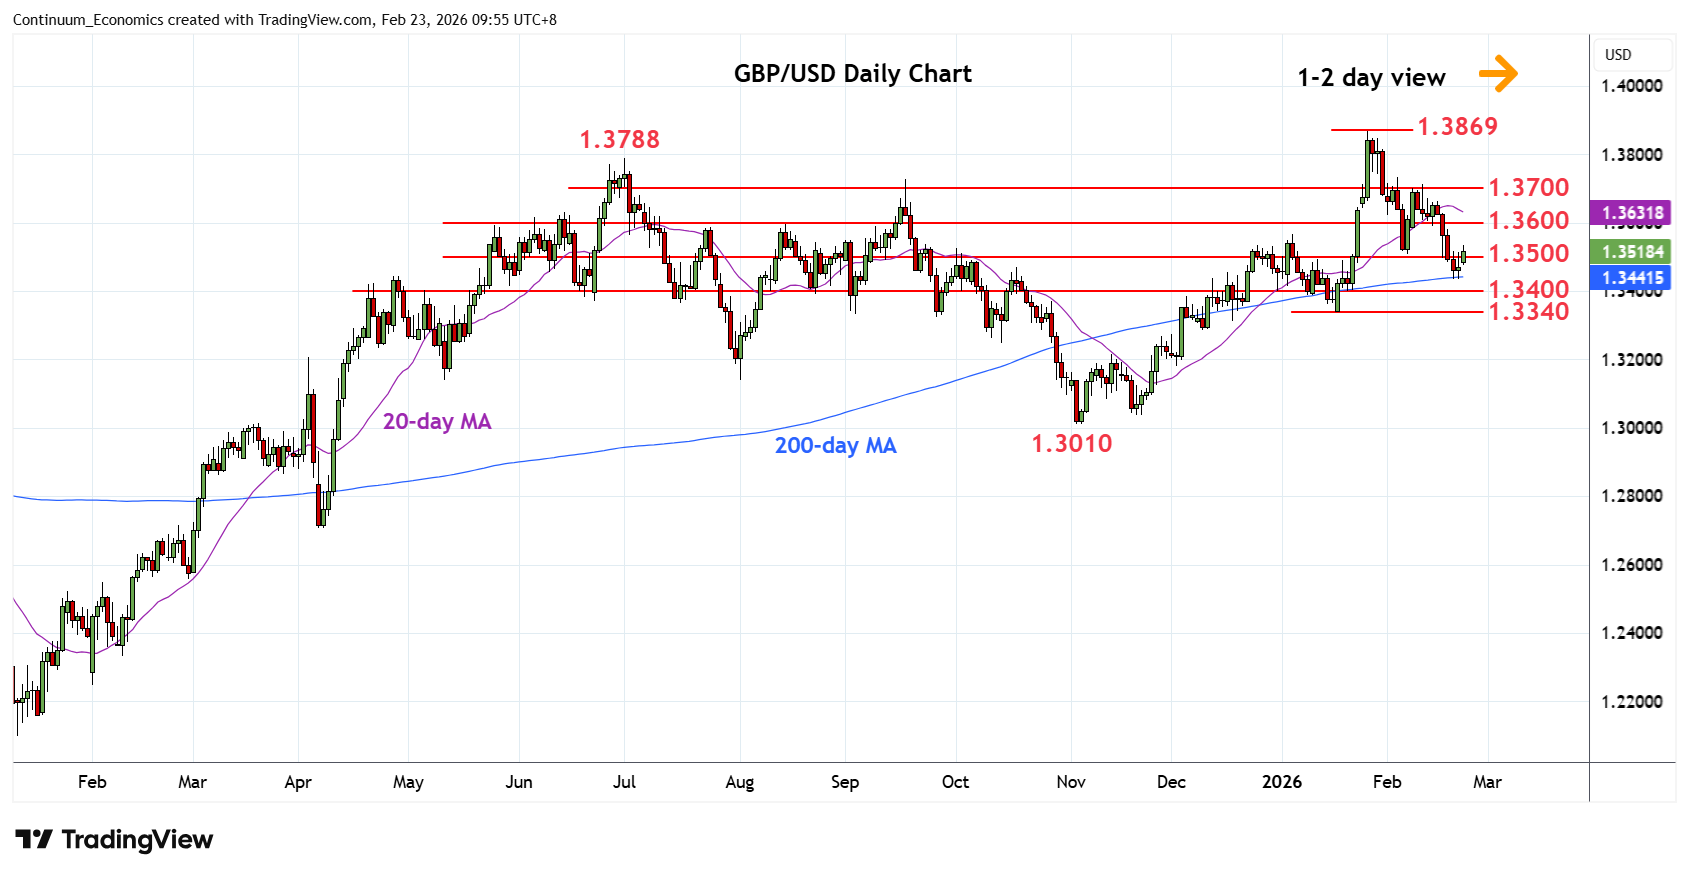
Extending bounce from support at the 1.3440, 50% Fibonacci level and 200-day MA, to regain the 1.3500 level
| Level | Comment | Level | Comment | |||||
|---|---|---|---|---|---|---|---|---|
| R4 | 1.3788 | ** | Jul 2025 yr high | S1 | 1.3440 | * | 50% Nov/Jan rally | |
| R3 | 1.3700 | * | congestion | S2 | 1.3400 | * | congestion | |
| R2 | 1.3600/20 | ** | congestion | S3 | 1.3340 | ** | 19 Jan YTD low, 61.8% | |
| R1 | 1.3568 | * | 6 Jan high | S4 | 1.3300 | * | congestion |
Asterisk denotes strength of level
02:00 GMT - Extending bounce from support at the 1.3440, 50% Fibonacci level and 200-day MA, to regain the 1.3500 level. Close above here will ease the downside pressure and open up room for stronger gains to retrace the 2-week losses from the 1.3700 level. Higher will see room to retest resistance 1.3568 and 1.3600/50 congestion. Meanwhile, support at 1.3440 now underpin. Would take break here to open up room for extension to the 1.3400 congestion then the 1.3340, 19 January YTD low and 61.8% Fibonacci level.