Chart USD/ZAR Update: Limited downside tests
Anticipated losses are giving way to consolidation above support within the 16.5000 - 16.6000 range
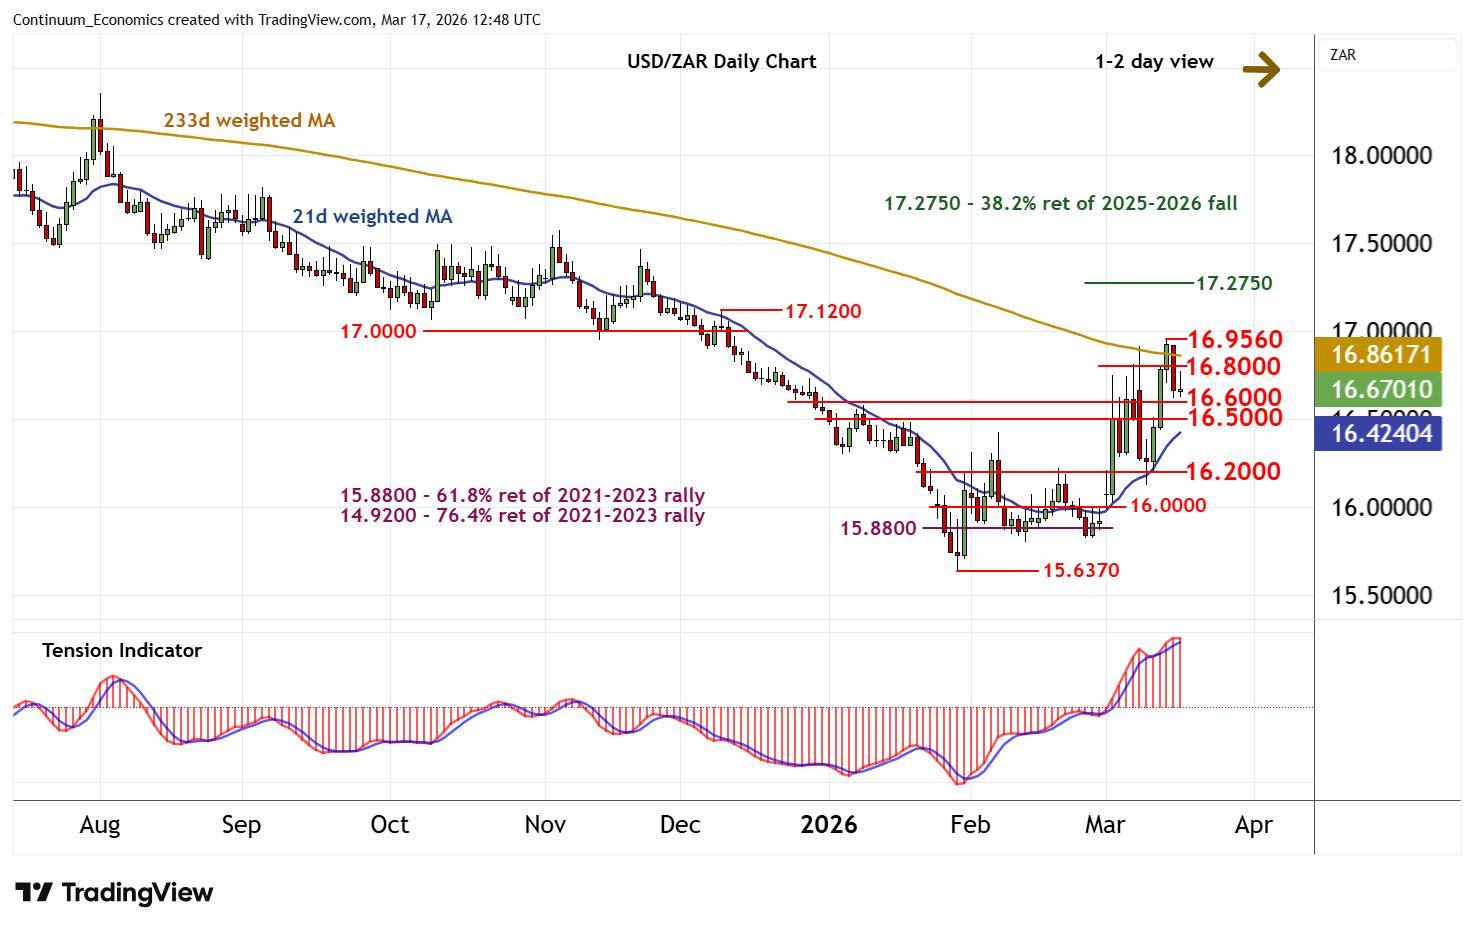
| Level | Comment | Level | Comment | |||||
|---|---|---|---|---|---|---|---|---|
| R4 | 17.1200 | * | 9 Dec (w) high | S1 | 16.6000 | break level | ||
| R3 | 17.0000 | * | congestion | S2 | 16.5000 | break level | ||
| R2 | 16.9560 | 13 Mar YTD high | S3 | 16.2000 | * | congestion | ||
| R1 | 16.8000 | congestion | S4 | 16.0000 | ** | congestion |
Asterisk denotes strength of level
12:05 GMT - Anticipated losses are giving way to consolidation above support within the 16.5000 - 16.6000 range, with prices currently trading around 16.6850. Overbought daily stochastics are ticking lower and the positive daily Tension Indicator is flattening, suggesting room for a test of here. But rising weekly charts should limit any break in renewed buying interest above congestion support at 16.2000. Meanwhile, resistance is at congestion around 16.8000 and extends to the 16.9560 current year high of 13 March. A close above here, not yet seen, will turn sentiment positive and extend late-January gains beyond further congestion around 17.0000 towards the 17.2750 Fibonacci retracement.