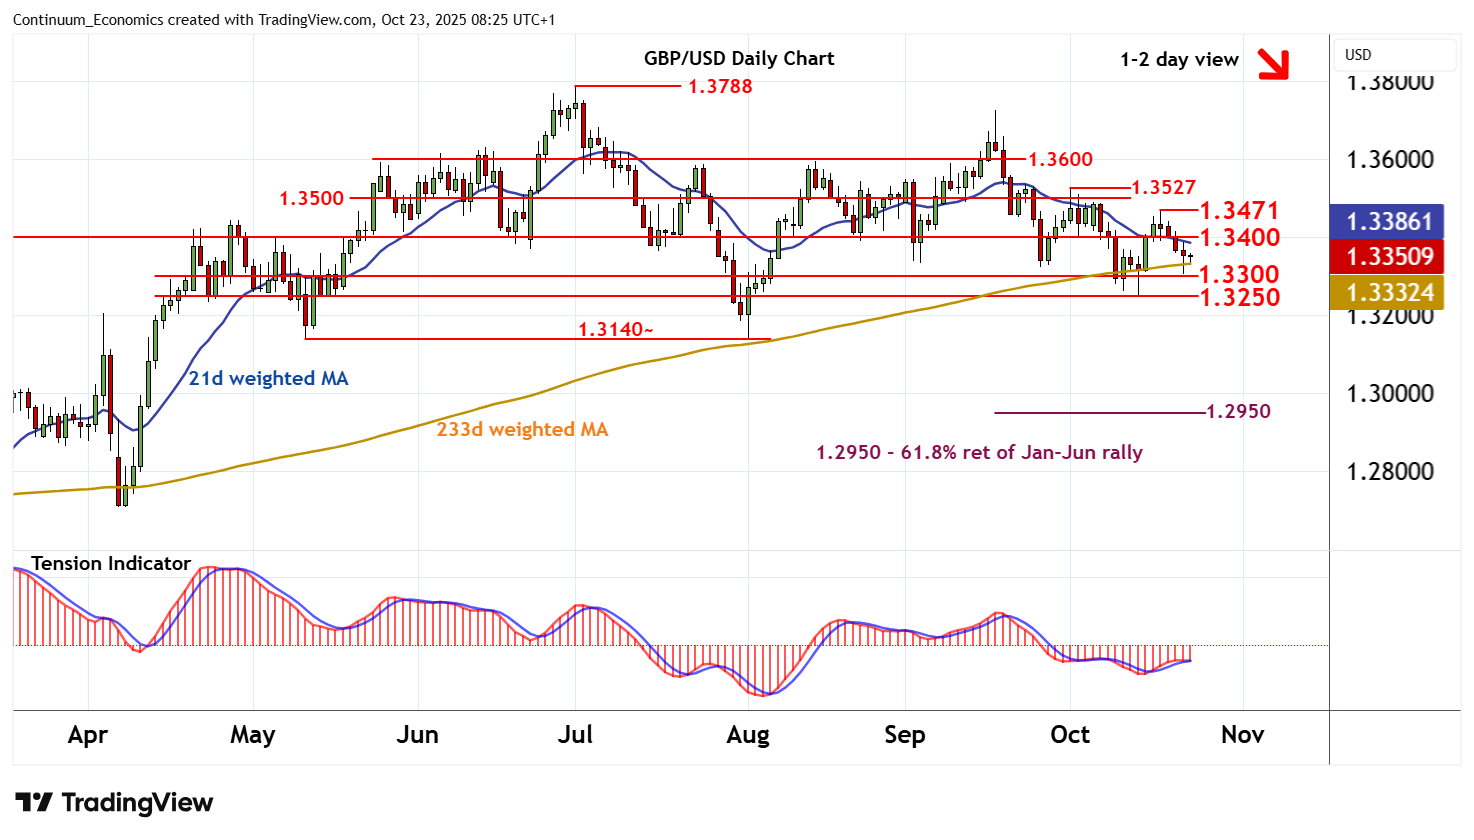
Chart GBP/USD Update: Studies continue to track lower
The anticipated break below congestion support at 1.3300 has not been seen
| Level | Comment | Level | Comment | |||||
|---|---|---|---|---|---|---|---|---|
| R4 | 1.3527 | ** | 1 Oct (w) high | S1 | 1.3300 | * | congestion | |
| R3 | 1.3500 | * | congestion | S2 | 1.3250 | * | congestion | |
| R2 | 1.3471 | 17 Oct (w) high | S3 | 1.3200 | * | congestion | ||
| R1 | 1.3400 | * | congestion | S4 | 1.3140~ | ** | May-Aug (m) range lows |
Asterisk denotes strength of level
08:10 BST - The anticipated break below congestion support at 1.3300 has not been seen, as unwinding oversold intraday studies prompt a smart bounce into choppy trade around 1.3350. Daily readings continue to deteriorate and broader weekly charts are negative, highlighting room for fresh losses in the coming sessions. A later break below 1.3300 will open up further congestion around 1.3250. Continuation of mid-September losses towards 1.3200 cannot be ruled out. Meanwhile, resistance remains at congestion around 1.3400. A close above here, if seen, would help to stabilise price action and give way to consolidation beneath the 1.3471 weekly high of 17 October.