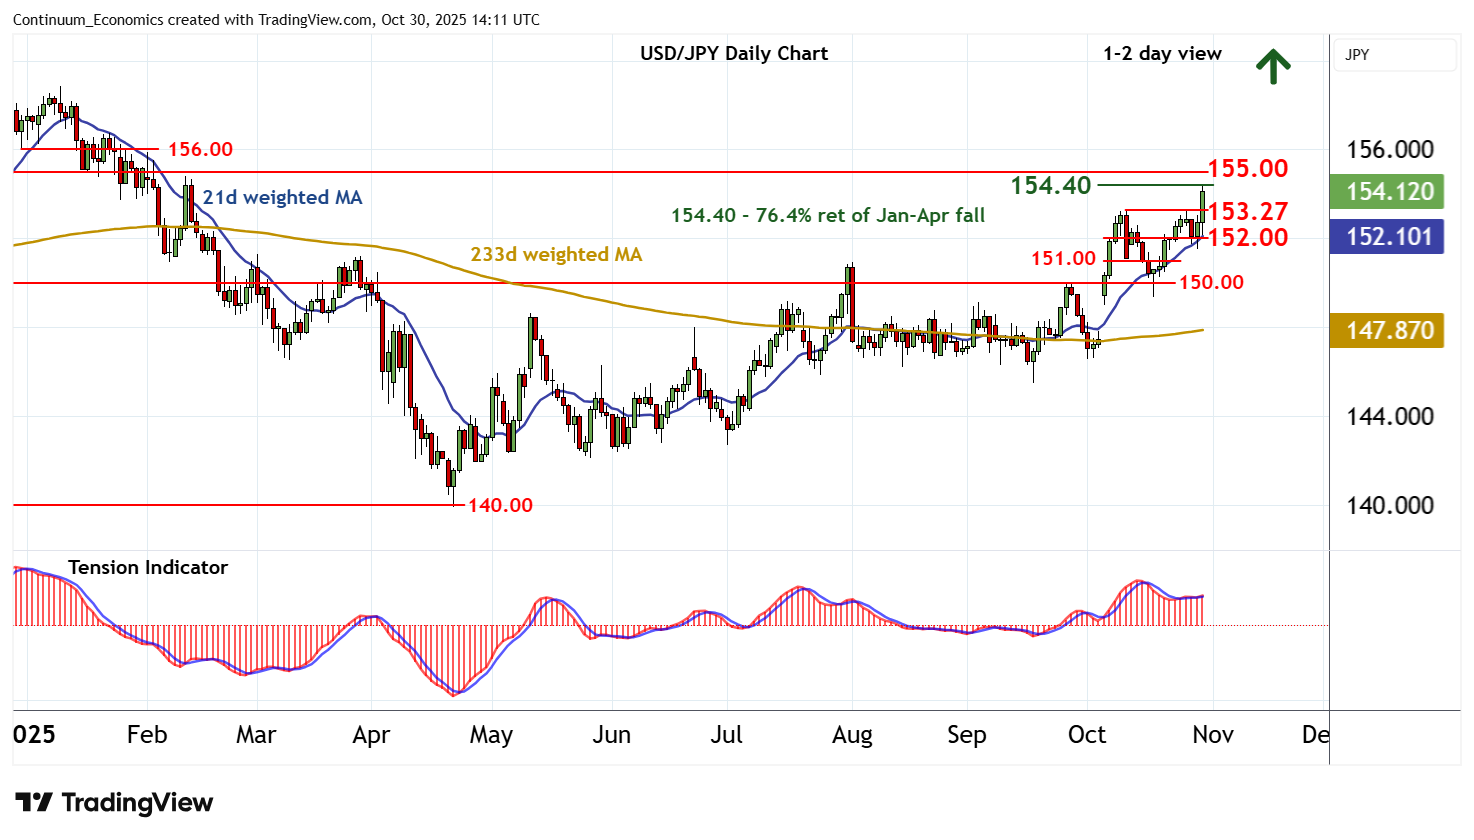
Chart USD/JPY Update: Consolidating test of strong resistance at the 154.40 Fibonacci retracement
Cautious trade around 152.00 has bounced sharply higher in both USD- and JPY-driven trade
| Levels | Imp | Comment | Levels | Imp | Comment | |||
|---|---|---|---|---|---|---|---|---|
| R4 | 157.00 | * | congestion | S1 | 153.27 | ** | 10 Oct (w) high | |
| R3 | 155.88/00 | * | February high; congestion | S2 | 152.00 | congestion | ||
| R2 | 155.00 | * | congestion | S3 | 151.00 | break level | ||
| R1 | 154.40 | ** | 76.4% ret of Jan-Apr fall | S4 | 150.00 | ** | congestion |
Asterisk denotes strength of level
13:55 GMT - Cautious trade around 152.00 has bounced sharply higher in both USD- and JPY-driven trade, with prices currently consolidating the test of strong resistance at the 154.40 Fibonacci retracement. Daily readings have ticked higher and broader weekly charts are positive, highlighting room for further strength in the coming sessions. A close above here will improve sentiment and extend April gains towards congestion around 155.00. Beyond here is the 155.88 high of February and congestion around 156.00. But flat overbought weekly stochastics are expected to limit any tests of here in profit-taking/consolidation. Meanwhile, support is raised to the 153.27 weekly high of 10 October. A close beneath here, if seen, would turn sentiment neutral and prompt consolidation above congestion around 152.00.