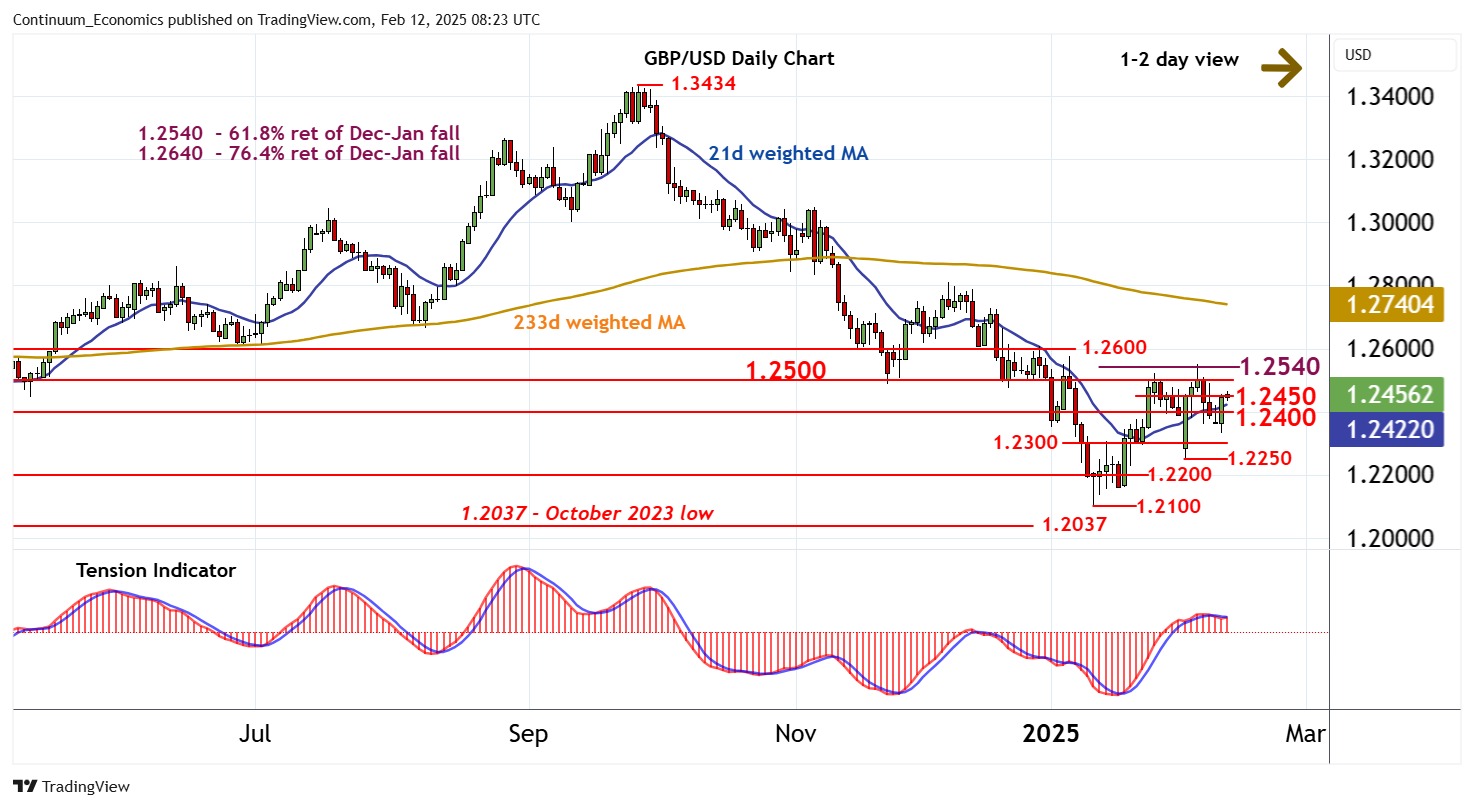
Chart GBP/USD Update: Smart bounce

Short-term consolidation around 1.2350 has given way to a bounce
| Level | Comment | Level | Comment | |||||
|---|---|---|---|---|---|---|---|---|
| R4 | 1.2640 | ** | 76.4% ret of Dec-Jan fall | S1 | 1.2450 | break level | ||
| R3 | 1.2600 | * | congestion | S2 | 1.2400 | * | congestion | |
| R2 | 1.2540 | ** | 61.8% ret of Dec-Jan fall | S3 | 1.2332 | 11 Feb low | ||
| R1 | 1.2500 | * | break level | S4 | 1.2300 | * | break level |
Asterisk denotes strength of level
08:10 GMT - Short-term consolidation around 1.2350 has given way to a bounce, as oversold intraday studies unwind, with steady gains currently trading above resistance at 1.2450. Negative daily stochastics are also flattening, suggesting potential for a test of resistance at 1.2500, where the flat daily Tension Indicator is expected to prompt fresh consolidation. Broader weekly charts are improving, but a further close above the 1.2540 Fibonacci retracement is needed to turn sentiment positive and confirm continuation of January gains. Meanwhile, support is down to congestion around 1.2400. A close beneath here would add weight to sentiment and open up 1.2300, where renewed buying interest is looked for.