Published: 2025-10-02T06:26:02.000Z
Chart EUR/GBP Update: Turned lower from .8752 resistance
1
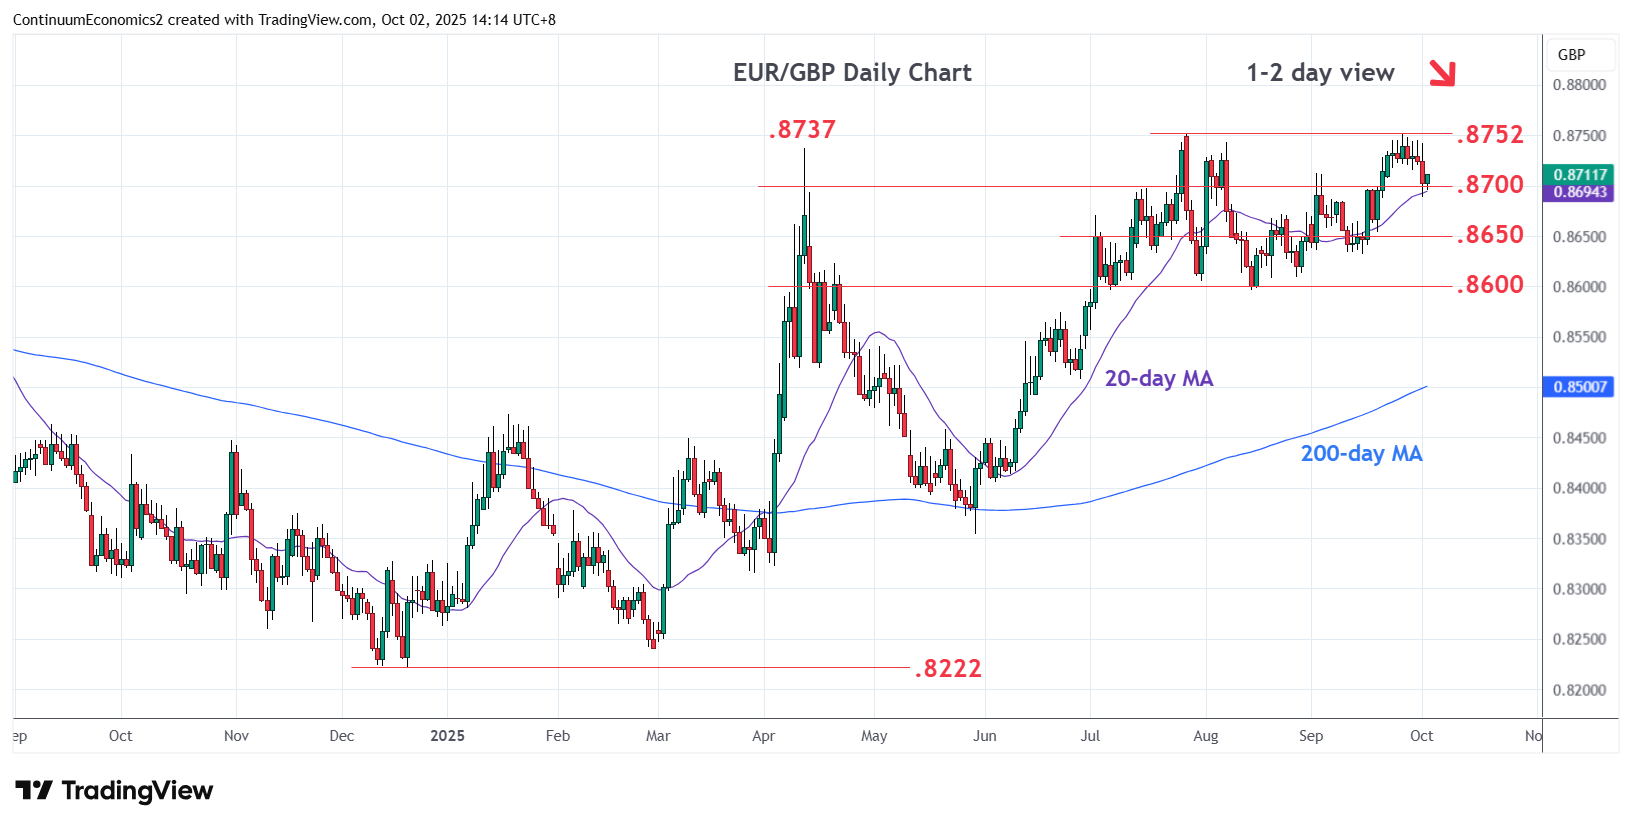
Consolidation below the .8745/.8752 July-September range highs has given way to pullback to reach the .8700 level
| Level | Comment | Level | Comment | |||||
|---|---|---|---|---|---|---|---|---|
| R4 | 0.8875 | * | 61.8% 2022/2024 fall | S1 | 0.8700 | * | congestion | |
| R3 | 0.8800 | * | figure, congestion | S2 | 0.8650 | * | congestion | |
| R2 | 0.8765 | ** | Nov 2023 high | S3 | 0.8632 | * | 15 Sep low | |
| R1 | 0.8752 | ** | 28 Jul YTD high, 50% | S4 | 0.8600 | ** | congestion, Aug low |
Asterisk denotes strength of level
06:20 GMT - Consolidation below the .8745/.8752 July-September range highs and 50% Fibonacci level has given way to pullback to reach the .8700 level. Negative daily studies suggest room for break here to open up room for deeper pullback to support at the .8650/.8632 area then the .8600 low of August. Meanwhile, resistance at the .8752 high is expected to cap. Break here, if seen, will further retrace the 2022/2024 losses and see room for extension to the .8765 resistance then the .8800 level.