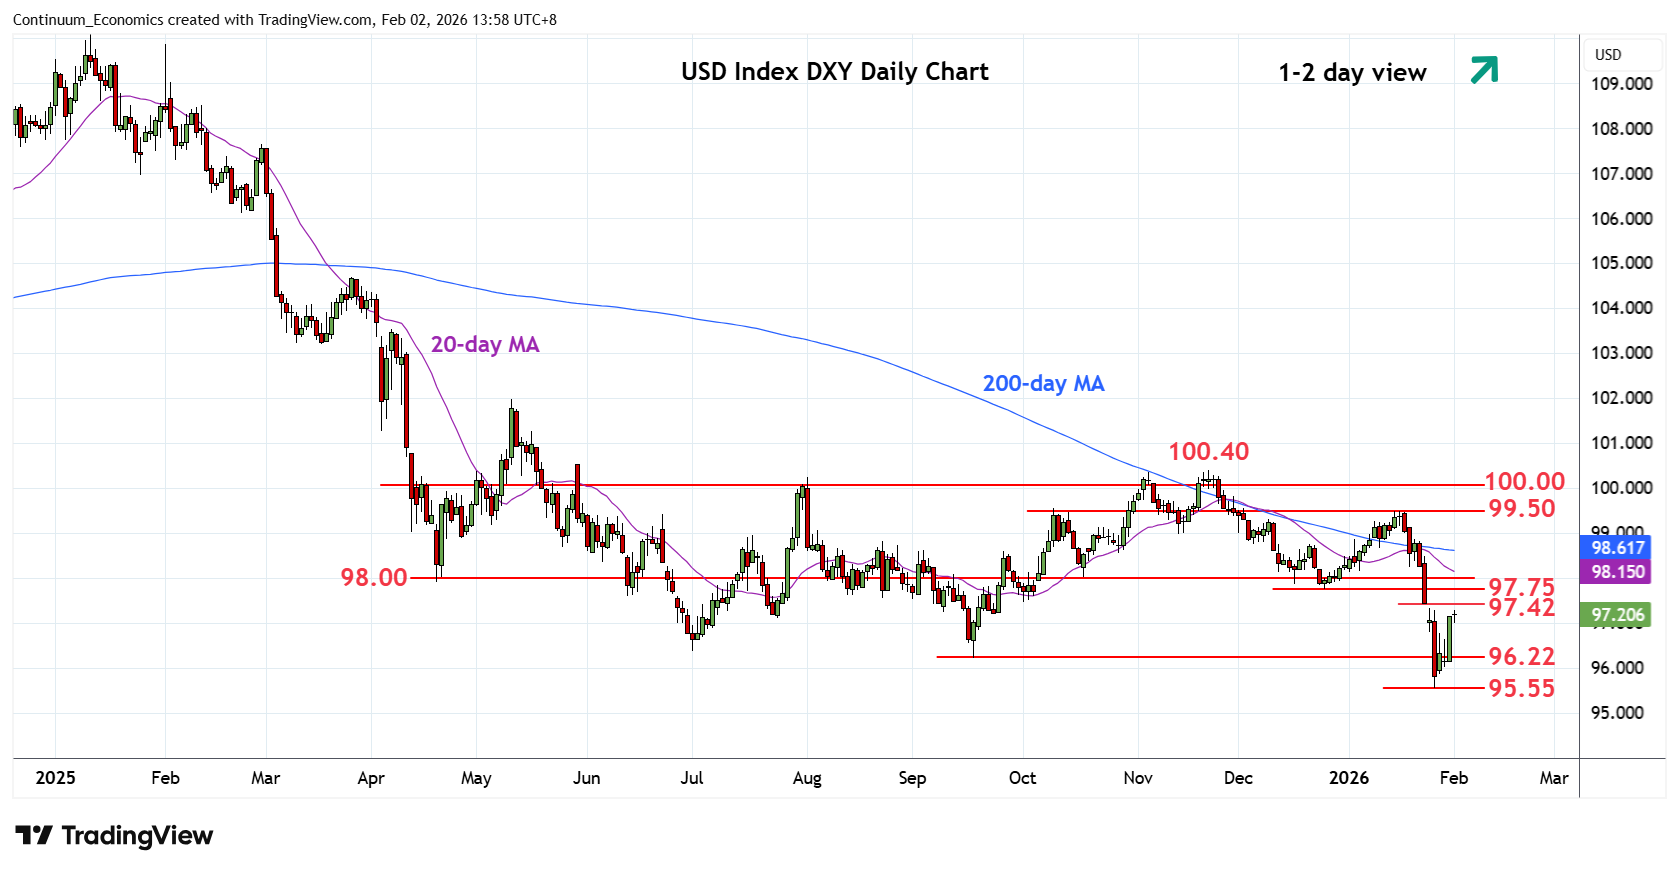
Chart USD Index DXY Update: Extend bounce from 95.55 low
Turned up from the 95.55 low of last week as prices retrace sharp losses from the 99.50 January high to approach the 97.33/97.42 gap area
| Levels | Imp | Comment | Levels | Imp | Comment | |||
|---|---|---|---|---|---|---|---|---|
| R4 | 98.50 | * | congestion | S1 | 97.00 | * | congestion | |
| R3 | 98.00 | ** | congestion | S2 | 96.22 | * | Sep low | |
| R2 | 97.75 | ** | Dec low, congestion | S3 | 95.55 | ** | 27 Jan YTD low | |
| R1 | 97.42 | * | 23 Jan low, gap | S4 | 95.25 | * | 76.4% 2021/2022 rally |
Asterisk denotes strength of level
06:15 GMT - Turned up from the 95.55 low of last week as prices retrace sharp losses from the 99.50 January high to approach the 97.33/97.42 gap area. Bounce see prices unwinding oversold daily studies and break here will open up room to strong resistance at 97.75/98.00 area. Corrective bounce expected to give way to renewed selling pressure later with support starting at the 97.00 level. Below this will return focus to the 96.22 support and 95.55 low. Break of the latter will extend the broader losses from 2022 year high and see room to support at 95.25/95.00, 76.4% Fibonacci level and congestion area.