Published: 2025-02-19T03:14:28.000Z
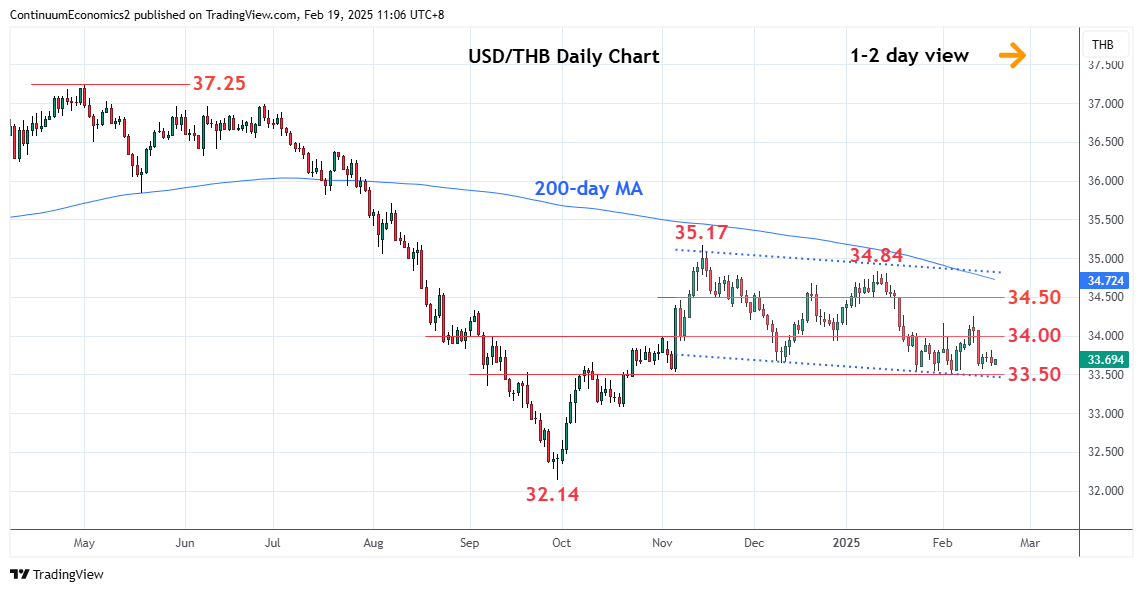
Chart USD/THB Update: Extend consolidation above 33.58 low

Technical Analyst
-
Little change, as prices drifts narrowly above the 33.58 low of last week
| Level | Comment | Level | Comment | |||||
|---|---|---|---|---|---|---|---|---|
| R4 | 34.50 | * | congestion | S1 | 33.58 | * | 14 Feb low | |
| R3 | 34.35 | * | 17 Jan low | S2 | 33.50 | ** | 5 Feb YTD low | |
| R2 | 34.25 | ** | 12 Feb high | S3 | 33.30 | * | 61.8% Sep/Nov rally | |
| R1 | 34.00 | * | congestion | S4 | 33.08 | * | 18 Oct low |
Asterisk denotes strength of level
03:10 GMT - Little change, as prices drifts narrowly above the 33.58 low of last week to consolidate losses from the 34.25 high. The resulting flag pattern suggest this giving way to fresh selling pressure later. Break of the 33.58 and 33.50 lows will extend the broader losses from the 35.17 high of November to retrace rally from the September low towards 33.30, 61.8% Fibonacci level. Meanwhile, resistance at the 34.00 congestion is expected to cap corrective bounce and sustain losses from the 34.25 high of last week.