Published: 2025-12-04T00:25:56.000Z
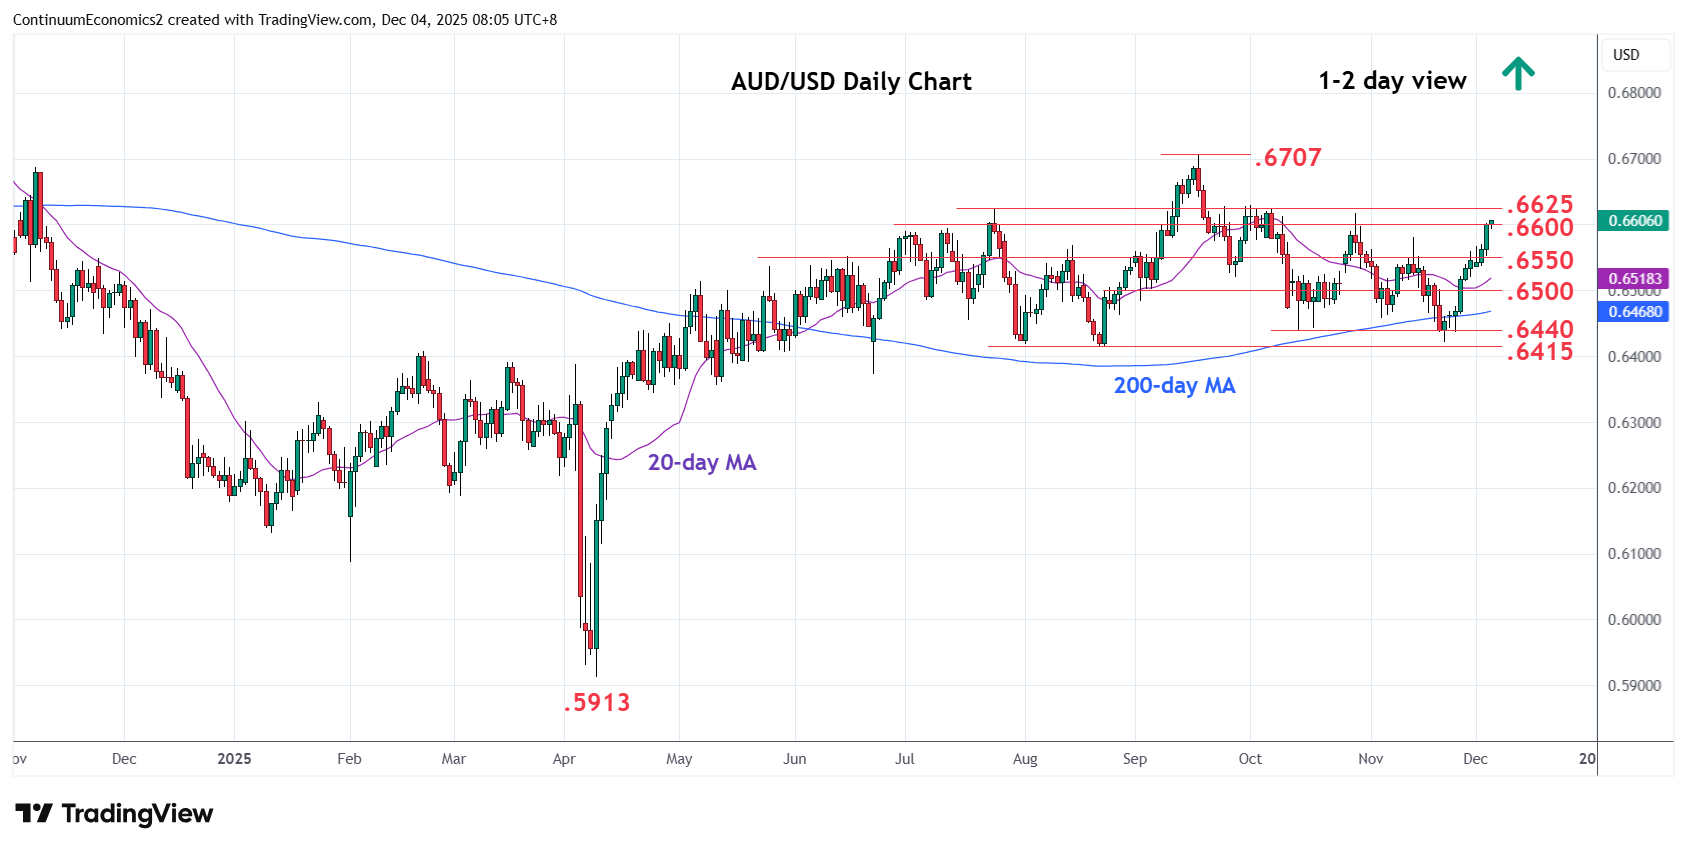
Chart AUD/USD Update: Pressuring .6600/25 resistance
-
Sharply higher as prices extend bullish break of the .6550 resistance to reach the .6600 level
| Levels | Imp | Comment | Levels | Imp | Comment | |||
|---|---|---|---|---|---|---|---|---|
| R4 | 0.6750 | * | congestion | S1 | 0.6580 | * | Nov high | |
| R3 | 0.6700/07 | ** | figure, 17 Sep YTD high | S2 | 0.6550 | * | congestion | |
| R2 | 0.6660 | * | 18 Sep high | S3 | 0.6500 | * | congestion | |
| R1 | 0.6600/25 | ** | congestion, Jul high | S4 | 0.6440/15 | ** | Oct, Aug lows |
Asterisk denotes strength of level
00:15 GMT - Sharply higher as prices extend bullish break of the .6550 resistance to reach the .6600 level. Clearance here will see room to the .6625, July high. Would expect reaction at these levels though a later break will expose the .6707 September current year high to retest. Break here will extend the broader gains from the April low to retrace losses from the September 2024 high. Meanwhile, support is raised to the .6580 November high and this extend to the .6550 congestion which is expected to underpin and sustain gains from the November low.