Chart GBP/USD Update: Consolidating beneath strong resistance at the 1.3555 Fibonacci retracement
The break above 1.3500 is meeting anticipated selling interest beneath strong resistance at the 1.3555 Fibonacci retracement
| Level | Comment | Level | Comment | |||||
|---|---|---|---|---|---|---|---|---|
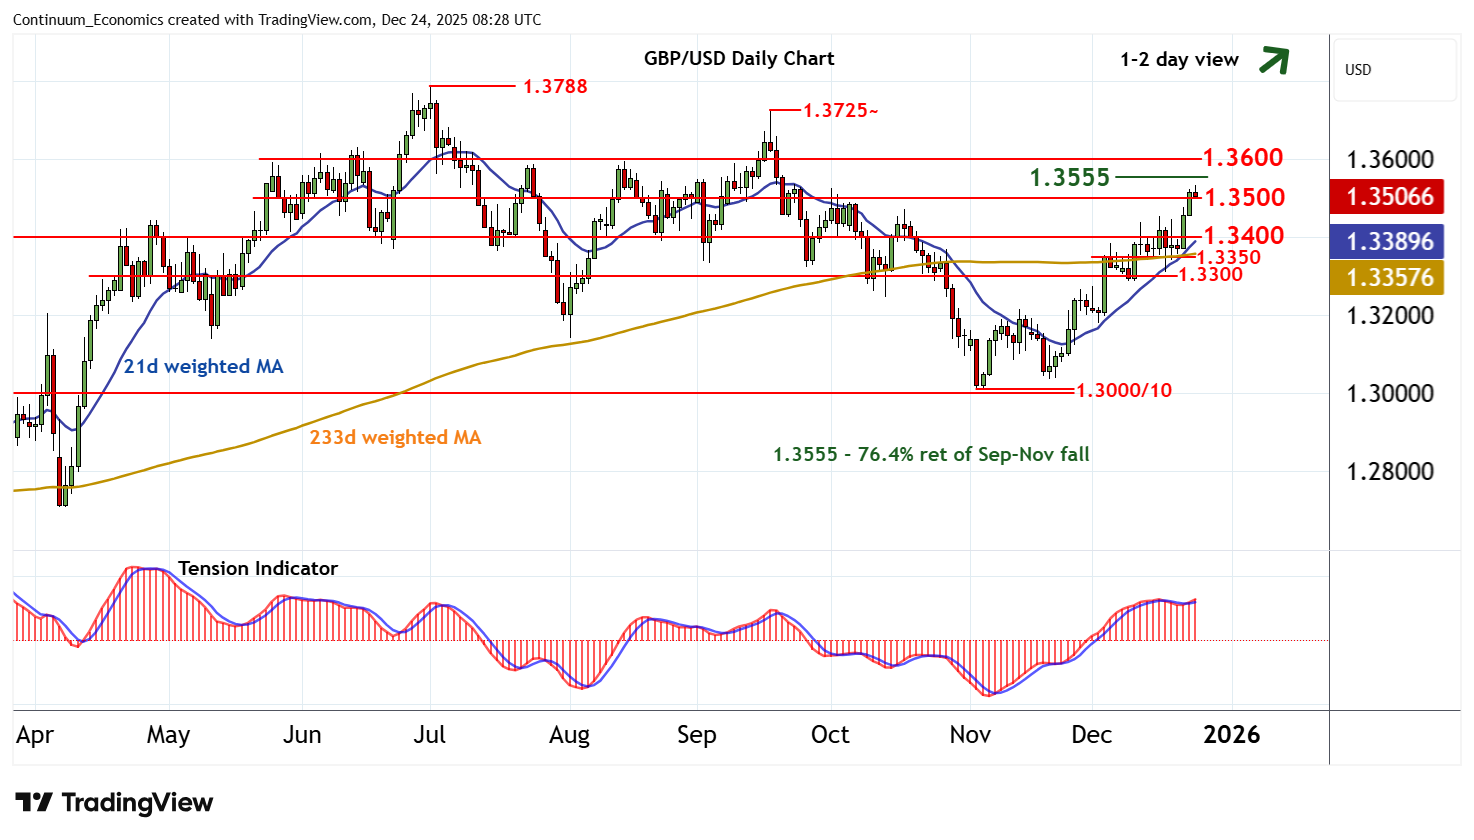
| R4 | 1.3788 | ** | 1 Jul YTD high | S1 | 1.3500 | * | congestion | |
| R3 | 1.3725~ | * | 17 Sep (m) high | S2 | 1.3400 | * | congestion | |
| R2 | 1.3600 | * | congestion | S3 | 1.3350 | * | recent lows | |
| R1 | 1.3555 | ** | 76.4% ret of Sep-Nov fall | S4 | 1.3300 | * | congestion |
Asterisk denotes strength of level
08:10 GMT - The break above 1.3500 is meeting anticipated selling interest beneath strong resistance at the 1.3555 Fibonacci retracement, with prices currently pressuring 1.3500. Intraday studies are under pressure, highlighting room for a test back beneath here. But rising daily readings and positive weekly charts are expected to limit any losses in renewed buying interest above further congestion around 1.3400. Following cautious trade, fresh gains are looked for. However, a close above 1.3555 is needed to turn sentiment positive and extend November gains towards congestion resistance at 1.3600.