Published: 2025-10-16T07:37:07.000Z
Chart GBP/USD Update: Edging higher
2
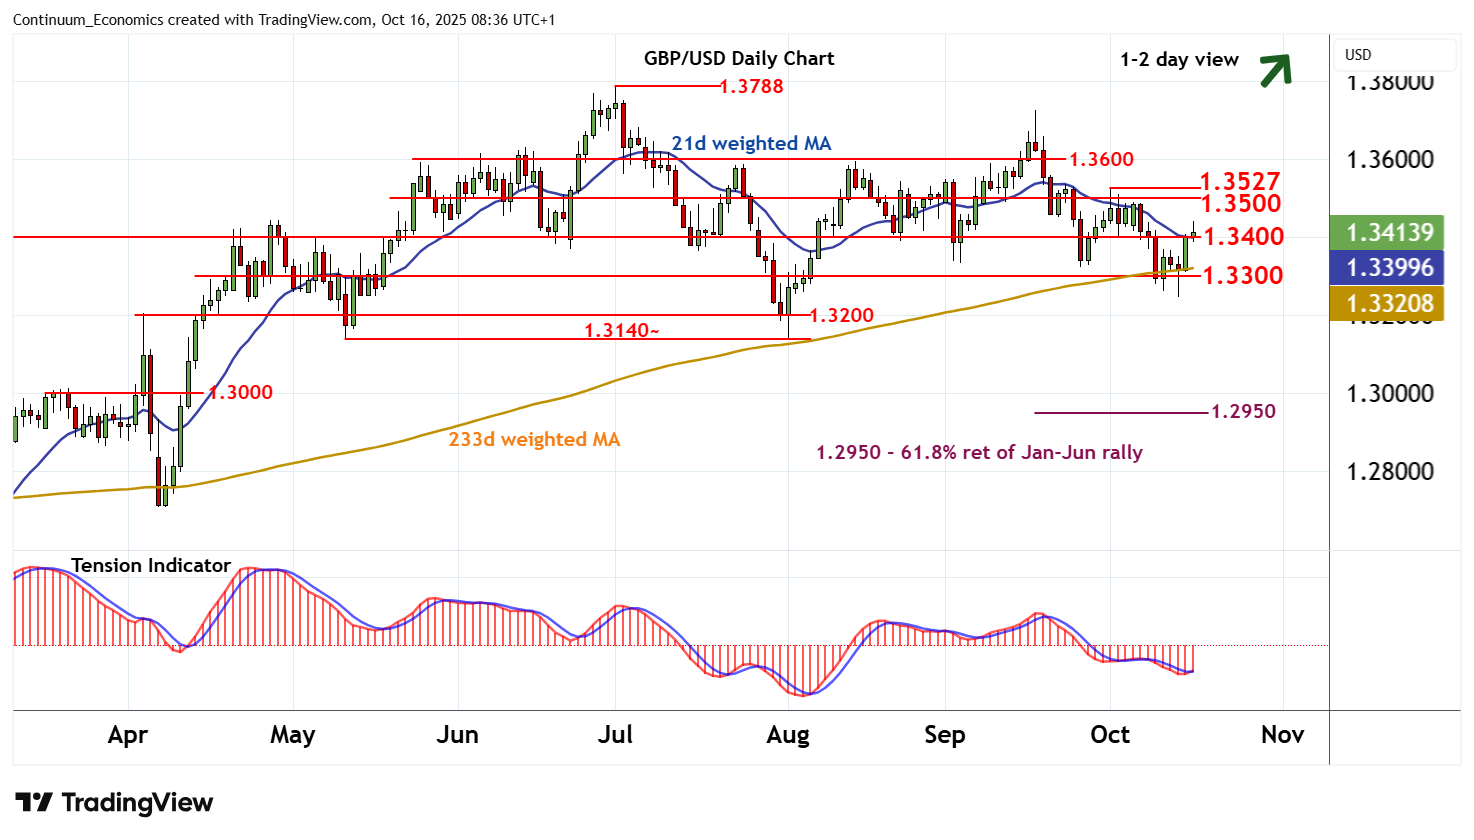
The anticipated test of 1.3400 has extended to 1.3440~
| Level | Comment | Level | Comment | |||||
|---|---|---|---|---|---|---|---|---|
| R4 | 1.3726 | ** | 17 Sep (m) high | S1 | 1.3400 | * | congestion | |
| R3 | 1.3600 | * | congestion | S2 | 1.3300 | * | congestion | |
| R2 | 1.3527 | ** | 1 Oct (w) high | S3 | 1.3248 | 14 Oct low | ||
| R1 | 1.3500 | * | congestion | S4 | 1.3200 | * | congestion |
Asterisk denotes strength of level
08:10 BST - The anticipated test of 1.3400 has extended to 1.3440~, where unwinding overbought intraday studies are prompting a pullback towards 1.3400. Daily readings are rising and oversold weekly stochastics are ticking higher, highlighting room for further strength in the coming sessions. A break above 1.3440~ will open up strong resistance at congestion around 1.3500 and the 1.3527 weekly high of 1 October, where the negative weekly Tension Indicator could promote consolidation. Meanwhile, any tests below congestion support at 1.3400 should be limited in consolidation above 1.3300.