Published: 2026-02-27T01:00:23.000Z
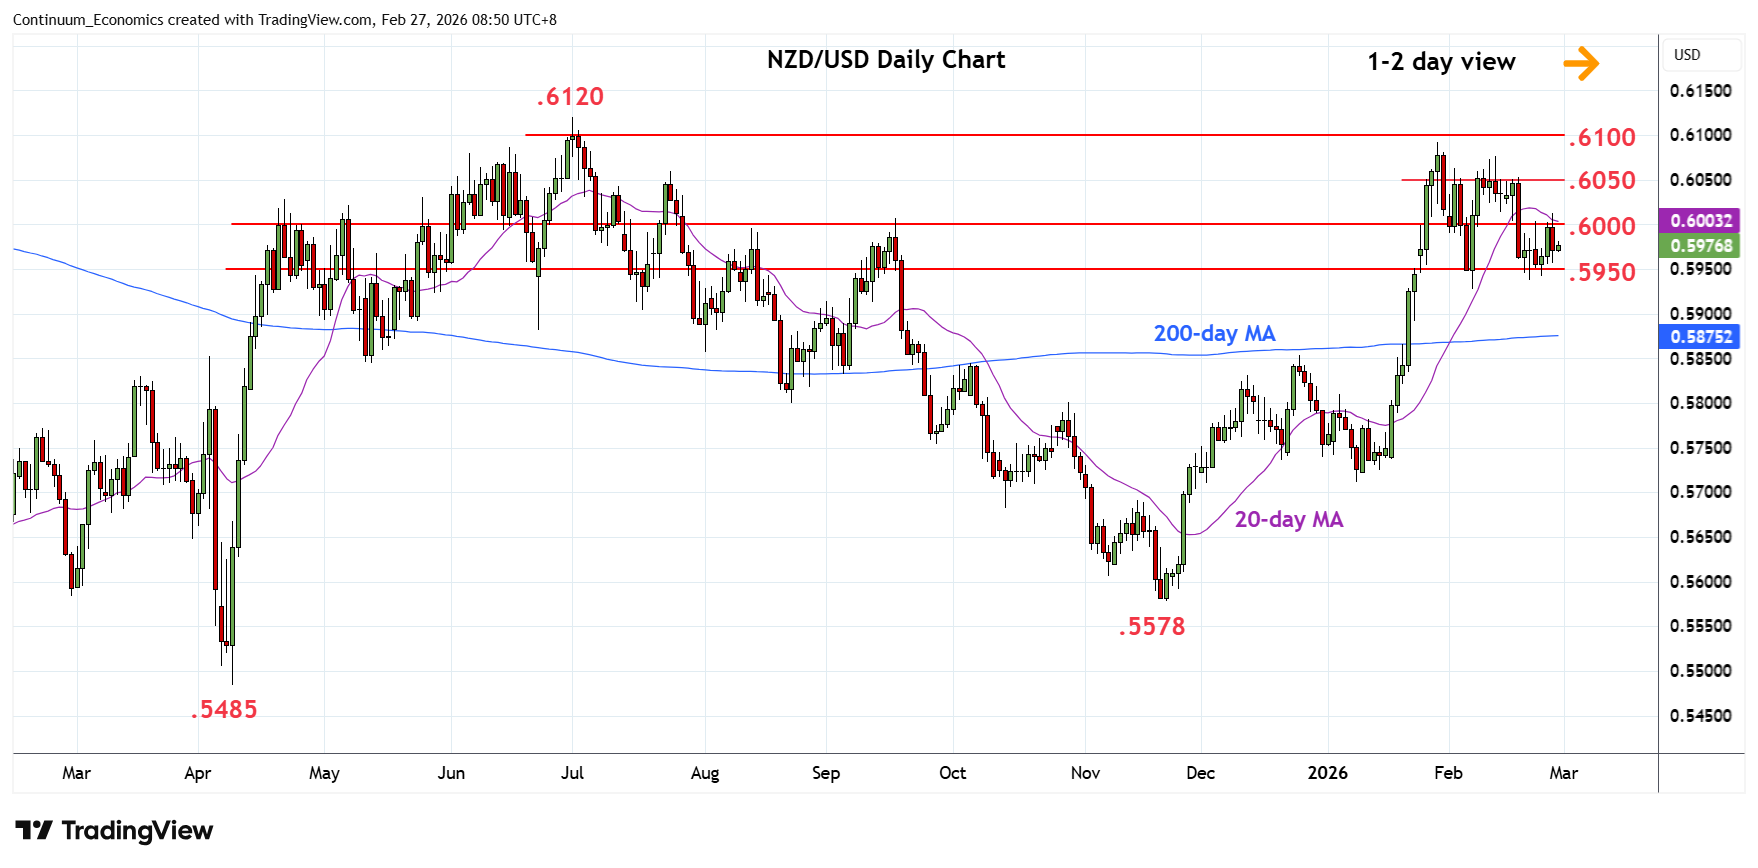
Chart NZD/USD Update: Extend consolidation below .6000
2
Settled back in consolidation after failing to regain the .6000 level
| Levels | Imp | Comment | Levels | Imp | Comment | |||
|---|---|---|---|---|---|---|---|---|
| R4 | .6093 | ** | 29 Jan YTD high | S1 | .5950 | * | congestion, 38.2% | |
| R3 | .6076 | * | 12 Feb high | S2 | .5928 | ** | 6 Feb low | |
| R2 | .6050 | ** | congestion | S3 | .5900 | * | 50% Jan rally | |
| R1 | .6000 | * | figure, congestion | S4 | .5853/50 | ** | Dec high, congestion |
Asterisk denotes strength of level
00:50 GMT - Settled back in consolidation after failing to regain the .6000 level. However, positive daily studies suggest scope for a later break to open up room for retest of the strong resistance at .6050. Clearance here will see room for extension to retest the .6076/.6093 highs and extend the broader gains from the November low. Meanwhile, support remains at the .5950 congestion which should underpin. Failure here will open up room for deeper pullback to retrace the January rally and see room to the .5900 level and 50% Fibonacci retracement.