Published: 2025-08-29T02:56:38.000Z
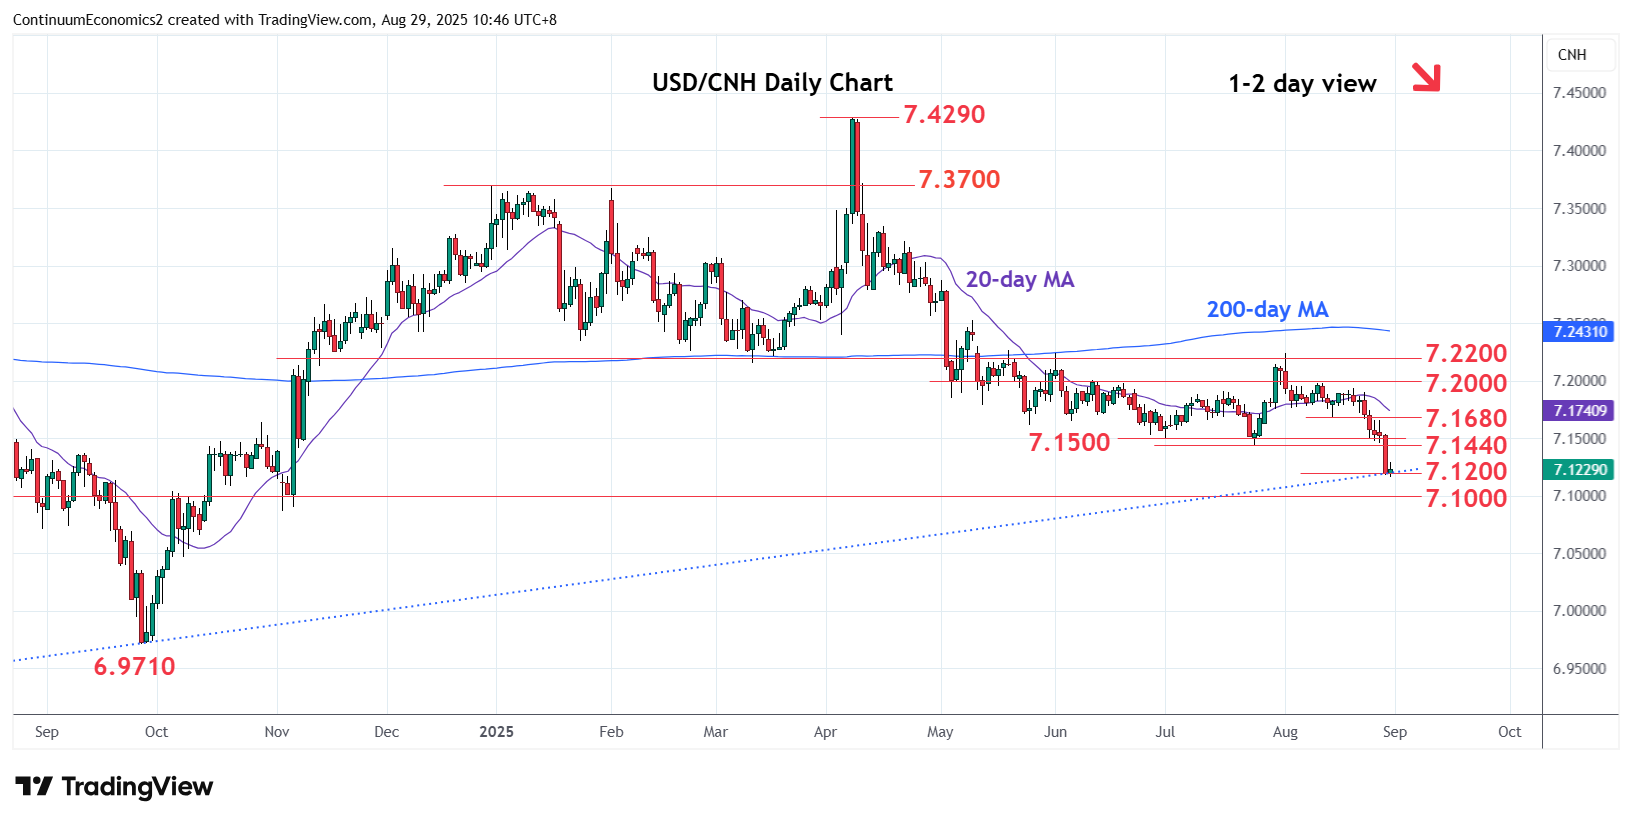
Chart USD/CNH Update: Consolidating test of 7.1200 support
0
-
Break of the July lows at the 7.1500/7.1440 area extend losses to test trendline from the January 2023 low at 7.1200

| Level | Imp | Comment | Level | Imp | Comment | |||
|---|---|---|---|---|---|---|---|---|
| R4 | 7.1680 | * | 14 Aug low | S1 | 7.1200 | * | congestion, trendline | |
| R3 | 7.1615 | * | May low | S2 | 7.1000 | ** | congestion | |
| R2 | 7.1500 | ** | congestion | S3 | 7.0870 | Nov 2024 low | ||
| R1 | 7.1440 | * | July low | S4 | 7.0800 | * | 76.4% 2024/Apr rally |
Asterisk denotes strength of level
02:50 GMT - Break of the July lows at the 7.1500/7.1440 area extend losses from the April high to test trendline from the January 2023 low at the 7.1200 congestion. Consolidation here see prices unwinding the oversold intraday and daily studies but scope is seen for break later. Lower will open up room to the 7.1000 level and the 1.0870/1.0800 area. Meanwhile, the July lows at the 7.1440/7.1500 area now reverts to resistance which is expected to cap and sustain losses from the 7.2240, high of 1st August.