Published: 2026-03-31T06:15:30.000Z
Chart AUD/JPY Update: Consolidating at 109.00, room for further losses
1
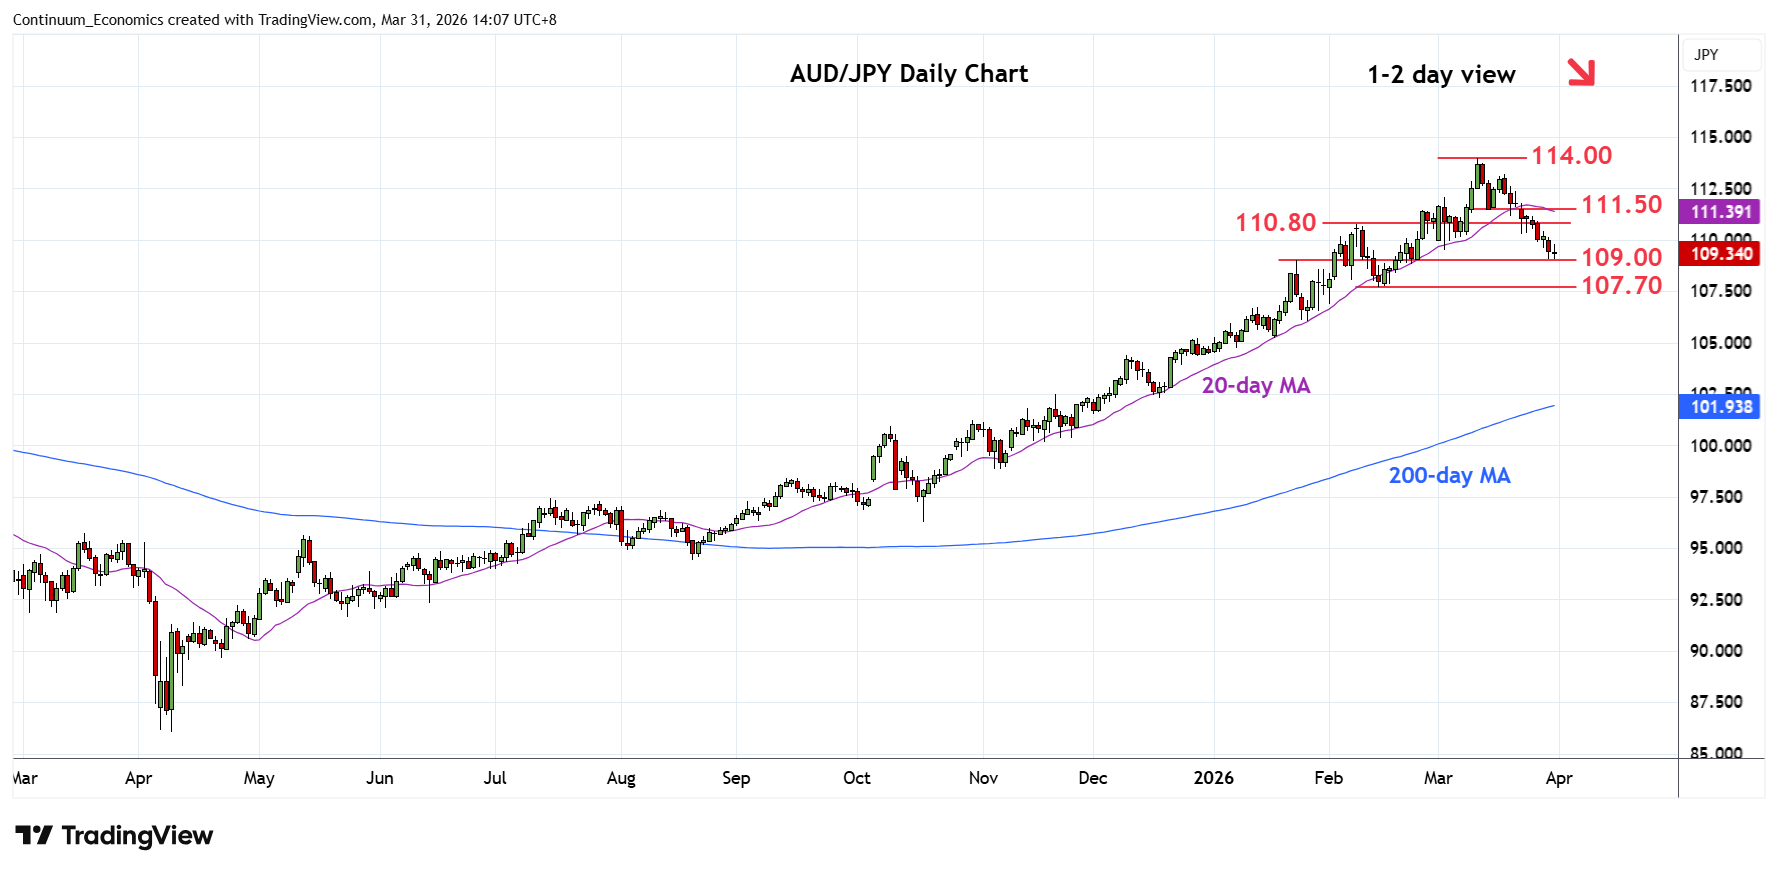
Steadied at the 109.00 level as prices consolidate the 2-week losses from the 113.20, 18 March high
| Levels | Imp | Comment | Levels | Imp | Comment | |||
|---|---|---|---|---|---|---|---|---|
| R4 | 114.00 | ** | 11 Mar YTD high | S1 | 109.00 | ** | Jan high | |
| R3 | 113.20 | * | 18 Mar high | S2 | 107.70 | * | 13 Feb low | |
| R2 | 111.50 | ** | 13 Mar low | S3 | 107.20 | * | 38.2% Oct/Mar rally | |
| R1 | 110.80 | * | 9 Feb high | S4 | 106.00 | * | congestion |
Asterisk denotes strength of level
06:10 GMT - Steadied at the 109.00 level as prices consolidate the 2-week losses from the 113.20, 18 March high. However, pressure remains on the downside and lower will see room for deeper pullback to retrace the October/March rally to support at the 108.00/107.70 area. Lower still, will see room to 107.20, 38.2% Fibonacci level. Meanwhile, resistance is lowered to the 110.80/111.50 area which is expected to cap. Regaining this will fade the downside pressure and return focus to the upside for retest of the 113.20 and 114.00, 18/11 March highs.