Chart GBP/USD Update: Choppy trade - studies under pressure
The spike down to the 1.3253 current year low of 3 March is giving way to choppy trade
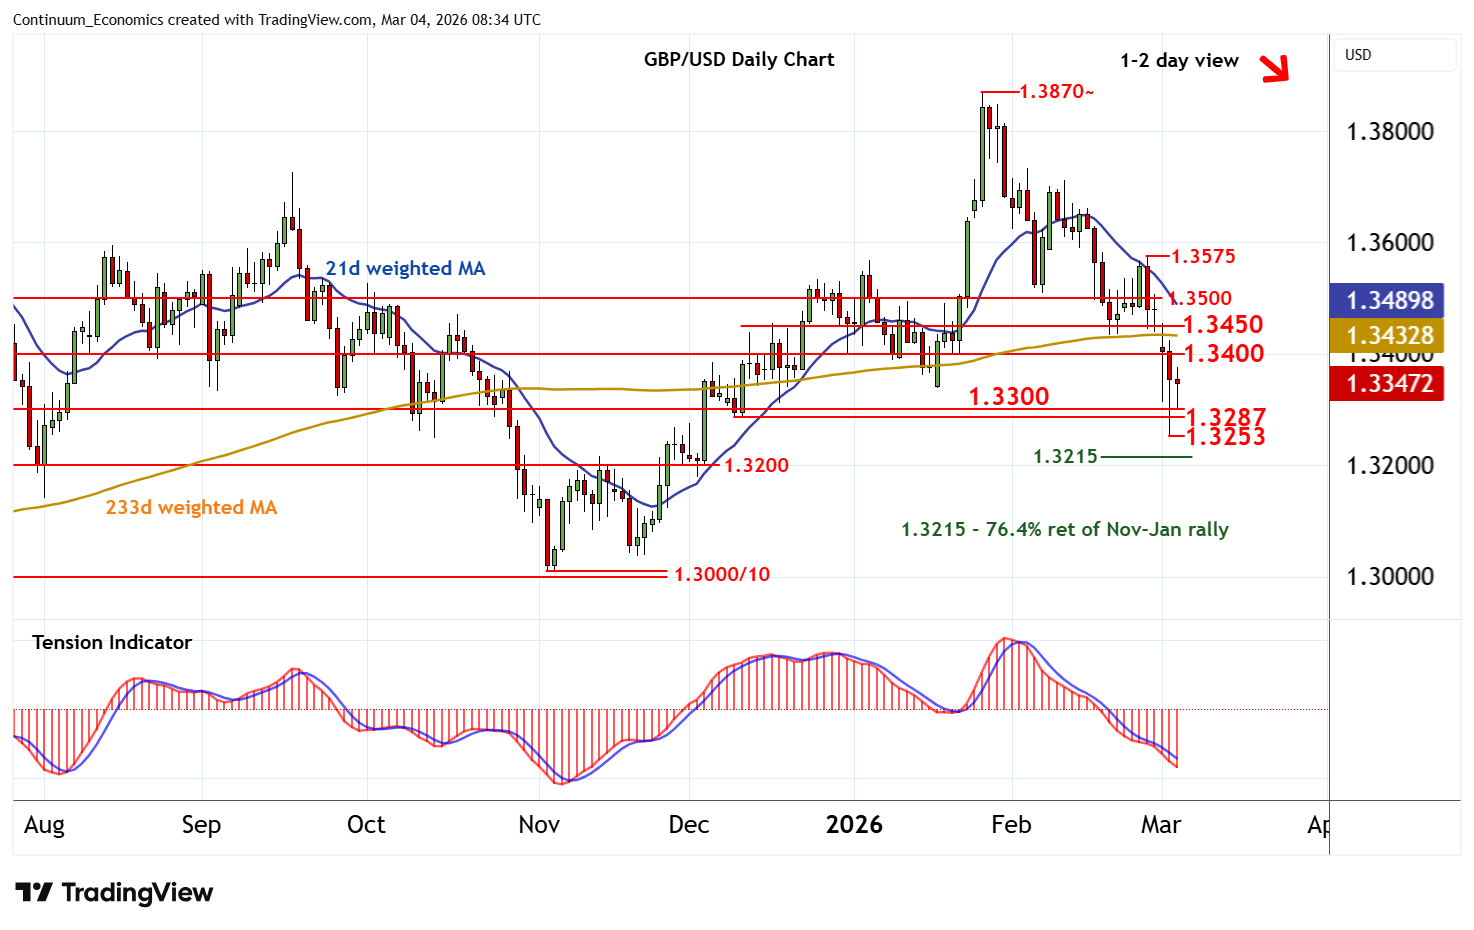
| Level | Comment | Level | Comment | |||||
|---|---|---|---|---|---|---|---|---|
| R4 | 1.3600 | * | congestion | S1 | 1.3300 | * | congestion | |
| R3 | 1.3500 | ** | congestion | S2 | 1.3287 | * | 9 Dec (w) low | |
| R2 | 1.3450 | ** | congestion | S3 | 1.3253 | 3 Mar YTD low | ||
| R1 | 1.3400 | ** | congestion | S4 | 1.3200/15 | ** | congestion; 76.4% ret |
Asterisk denotes strength of level
08:10 GMT - The spike down to the 1.3253 current year low of 3 March is giving way to choppy trade, as intraday studies turn higher, with prices currently balanced above the 1.3287 weekly low of 9 December and congestion around 1.3300. A minor test higher is highlighted. But negative daily and weekly charts should limit scope in renewed selling interest beneath congestion resistance at 1.3400. In the coming sessions, choppy trade is expected to give way to fresh losses. A break below 1.3287/00 will open up 1.3253, with a further close beneath here adding weight to sentiment and extending late-January losses towards congestion around 1.3200 and the 1.3215 Fibonacci retracement. Already oversold daily stochastics could limit any initial tests of this range in short-covering/consolidation.