Published: 2026-03-26T09:00:21.000Z
Chart USD Index DXY Update: Edging higher
2
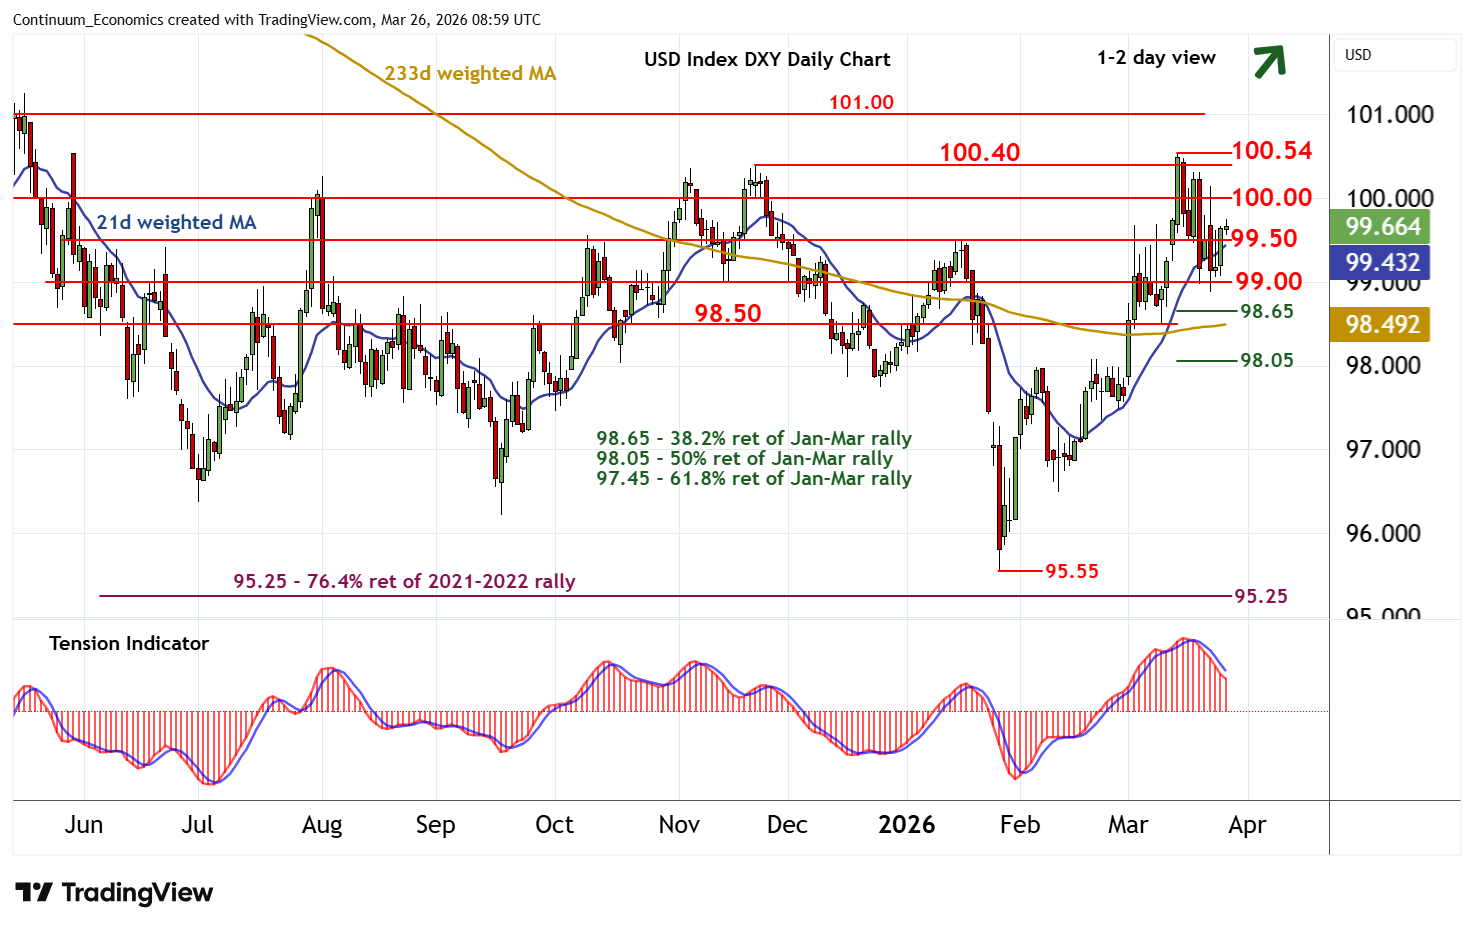
Consolidation above congestion support at 99.00 has given way to a push higher
| Levels | Imp | Comment | Levels | Imp | Comment | |||
|---|---|---|---|---|---|---|---|---|
| R4 | 101.15 | ** | 38.2% ret of 2025-2026 fall | S1 | 99.50 | * | congestion | |
| R3 | 101.00 | * | congestion | S2 | 99.00 | ** | congestion | |
| R2 | 100.40/54 | ** | 21 Nov (m); 13 Mar YTD highs | S3 | 98.65 | * | 38.2% ret of Jan-Mar rally | |
| R1 | 100.00 | ** | congestion | S4 | 98.50 | * | congestion |
Asterisk denotes strength of level
08:50 GMT - Consolidation above congestion support at 99.00 has given way to a push higher, with prices currently balanced around 99.65. Intraday studies are mixed/positive and oersold daily stochastics are ticking higher, highlighting room for continuation towards congestion resistance at 100.00. But the negative daily Tension Indicator is expected to limit any immediate tests beyond here in consolidation beneath critical resistance at 100.40/54. Meanwhile, support is raised to congestion around 99.50. A close back beneath here would help to stabilise price action and prompt consolidation above congestion around 99.00.