Published: 2024-04-16T10:50:14.000Z
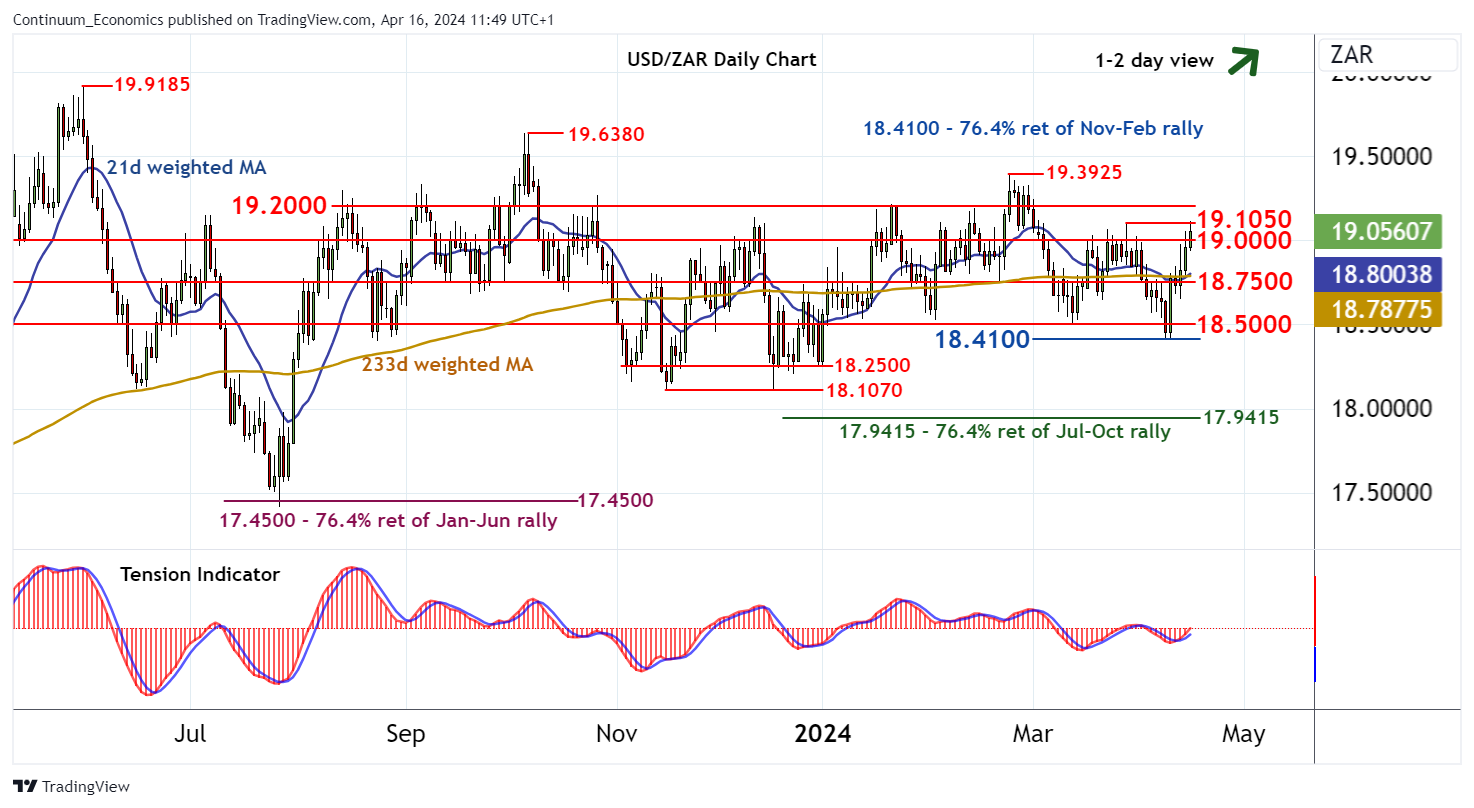
Chart USD/ZAR Update: Extending pressure on strong resistance at 19.0000 - 19.1050
-
Little change, as prices extend pressure on resistance within 19.0000 - 19.1050

| Levels | Imp | Comment | Levels | Imp | Comment | |||
| R4 | 19.3925 | ** | 23 Feb YTD high | S1 | 18.7500 | * | congestion | |
| R3 | 19.2000 | break level | S2 | 18.5000 | ** | congestion | ||
| R2 | 19.1050 | * | 28 Mar (w) high | S3 | 18.4100 | ** | 76.4% ret of Nov-Feb rally | |
| R1 | 19.0000 | * | congestion | S4 | 18.2500 | ** | congestion | |
Asterisk denotes strength of level
11:40 BST - Little change, as prices extend pressure on resistance within 19.0000 - 19.1050. Overbought intraday studies are flattening, suggesting short-term consolidation within here. However, daily readings continue to rise, pointing to potential for a later break and continuation of April gains towards 19.2000. Already overbought daily stochastics are expected to limit any initial tests of here in fresh consolidation. Meanwhile, support remains down to congestion around 18.7500 and should underpin downside tests.