Published: 2026-03-03T12:57:00.000Z
Chart USD/ZAR Update: Poised for further gains
1
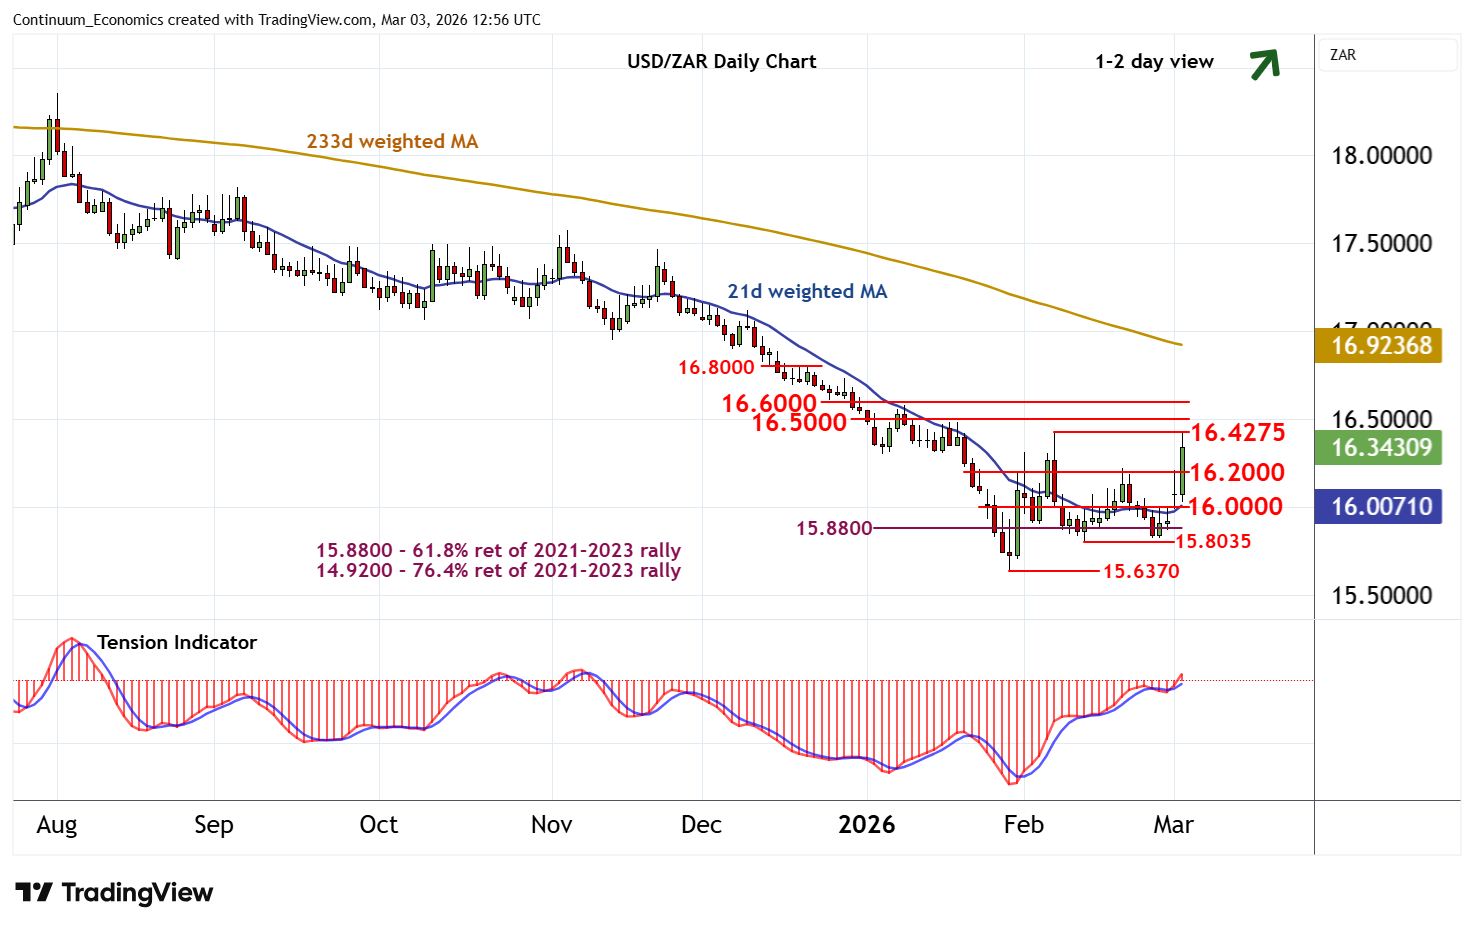
Anticipated gains have reached resistance at the 16.4275 monthly high of 6 February
| Level | Comment | Level | Comment | |||||
|---|---|---|---|---|---|---|---|---|
| R4 | 16.8000 | * | break level | S1 | 16.2000 | * | congestion | |
| R3 | 16.6000 | break level | S2 | 16.0000 | ** | congestion | ||
| R2 | 16.5000 | break level | S3 | 15.8035 | ** | 12 Feb (m) low | ||
| R1 | 16.4275 | ** | 6 Feb (m) high | S4 | 15.6370 | ** | 29 Jan YTD low |
Asterisk denotes strength of level
12:30 GMT - Anticipated gains have reached resistance at the 16.4275 monthly high of 6 February, where short-term reactions are prompting a pullback to 16.3500. Daily studies are rising and broader weekly charts are improving, highlighting room for further strength in the coming sessions. A close above here will improve sentiment and extend late-January gains, initially into the 16.5000 - 16.6000 range. Beyond here is 16.8000. Meanwhile, support is raised to congestion around 16.2000. A close back beneath here, if seen, will turn sentiment neutral and prompt consolidation above congestion around 16.0000.