Published: 2026-03-19T00:40:16.000Z
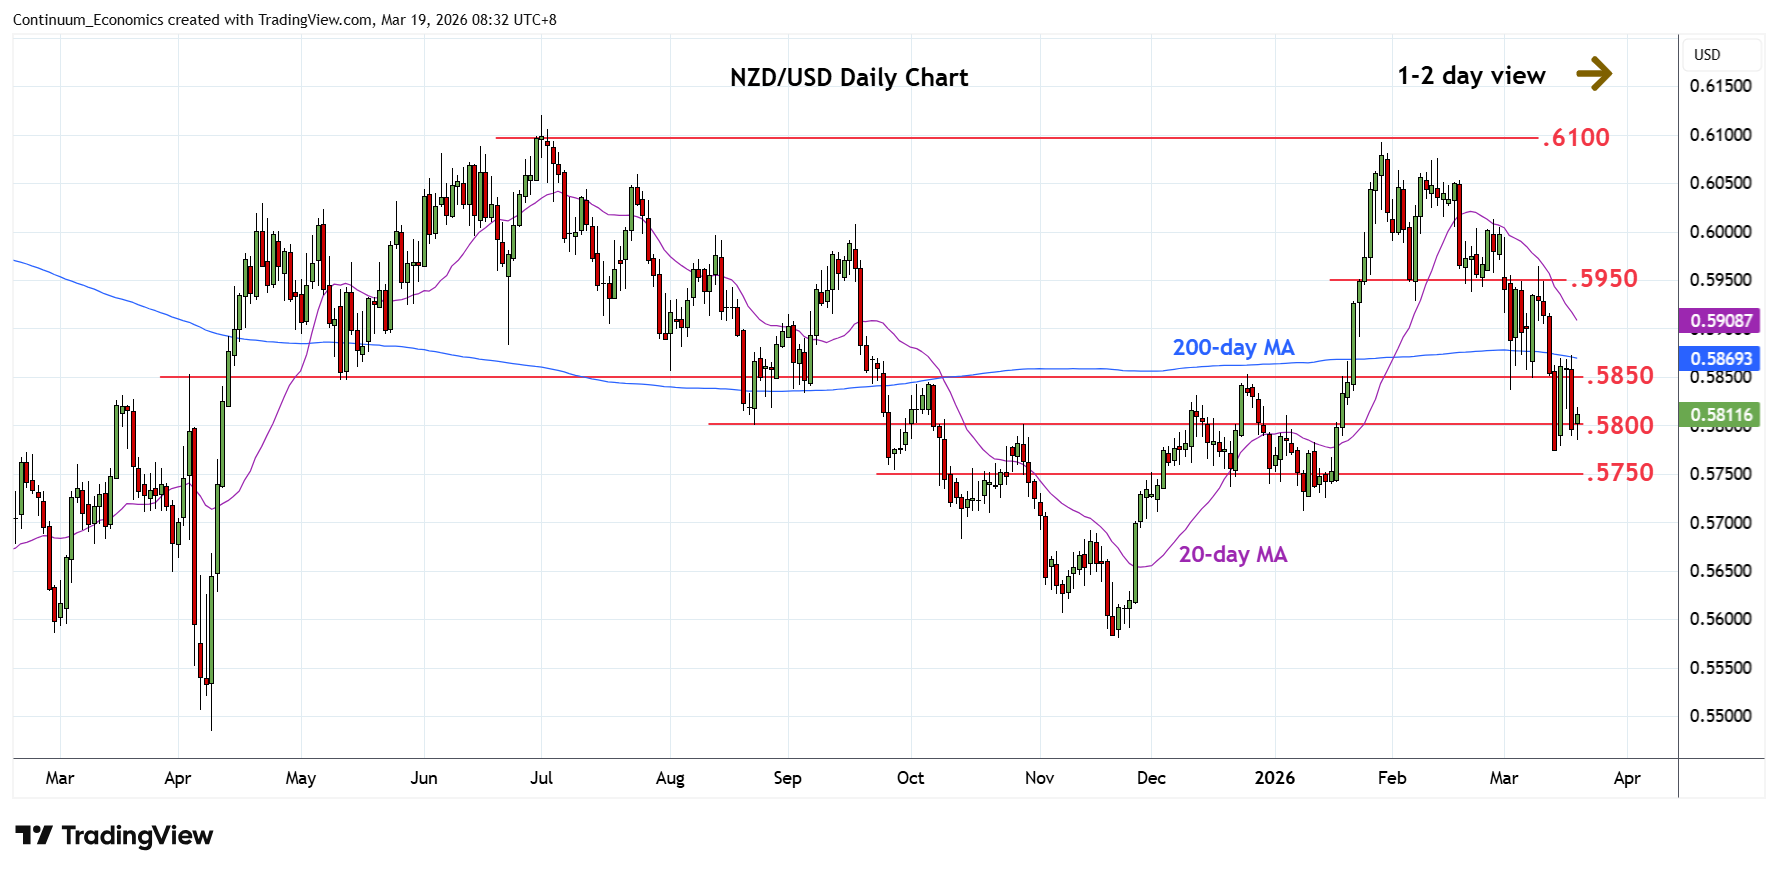
Chart NZD/USD Update: Extend choppy trade below 200-day MA
-
Turned back down from test of the 200-day MA at .5870 to retest the .5800 level
| Levels | Imp | Comment | Levels | Imp | Comment | |||
|---|---|---|---|---|---|---|---|---|
| R4 | .6000/13 | * | congestion, 26 Feb high | S1 | .5800 | * | congestion | |
| R3 | .5930/50 | ** | 6 Feb low, congestion | S2 | .5775 | * | 61.8% Nov/Jan rally | |
| R2 | .5900 | * | congestion | S3 | .5750 | * | congestion | |
| R1 | .5870 | ** | 200-day MA | S4 | .5710/00 | ** | Jan YTD low, 76.4% |
Asterisk denotes strength of level
00:30 GMT - Turned back down from test of the 200-day MA at .5870 to retest the .5800 level and extend recent choppy trade from the .5775 low. Negative daily and weekly studies see risk for break here to further extend the January losses. Lower will see room to the .5750 congestion then the .5710/00, January current year low and congestion area. Meanwhile, resistance at the .5850/70 congestion and 200-day MA expected to cap. Would need to clear this to fade the downside pressure and open up room for stronger bounce to the .5900 level.