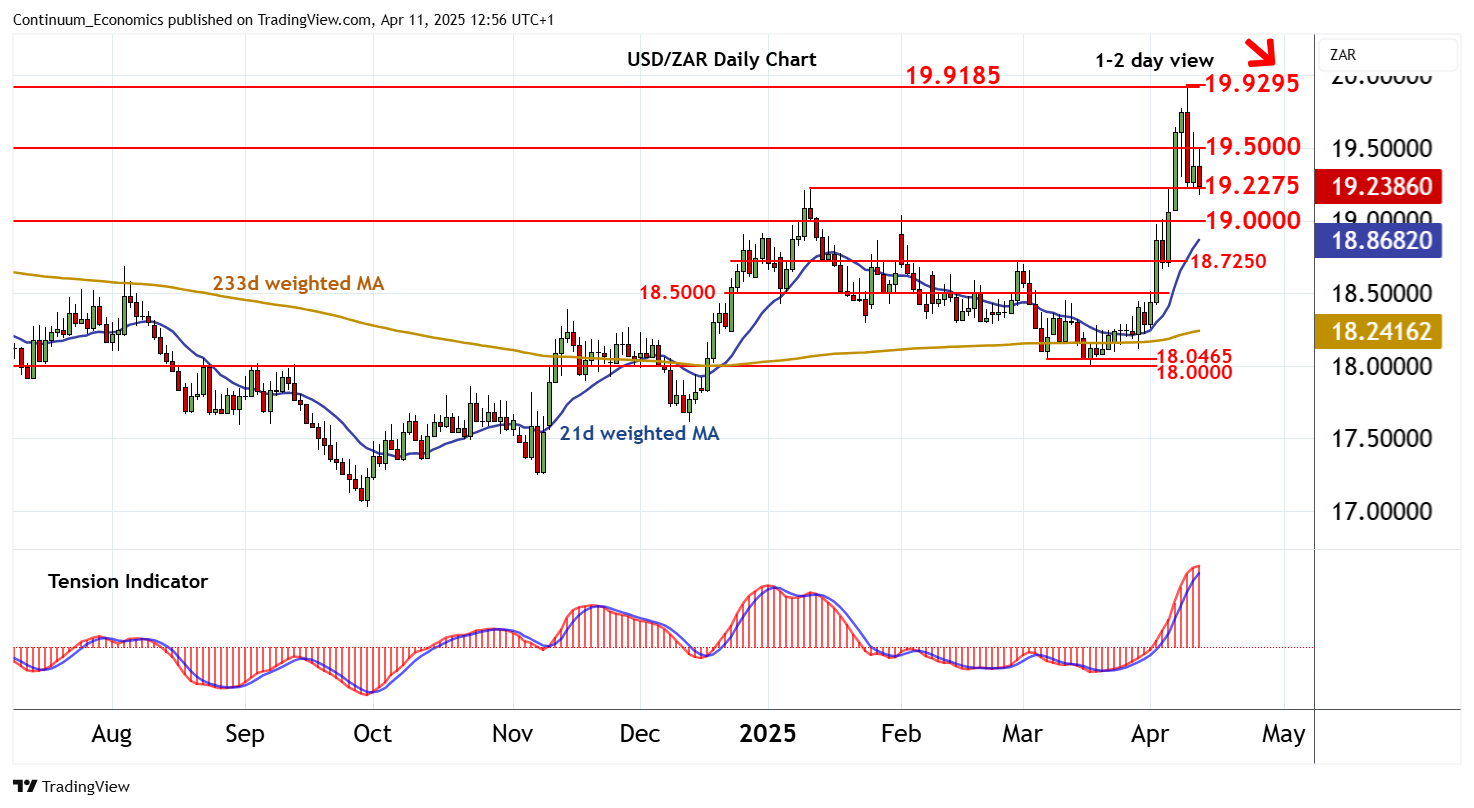
Chart USD/ZAR Update: Leaning lower

Little change, as prices extend consolidation within the 19.2275 - 19.5000 range
| Level | Comment | Level | Comment | |||||
|---|---|---|---|---|---|---|---|---|
| R4 | 20.0000 | figure | S1 | 19.2275 | * | 13 Jan (m) high | ||
| R3 | 19.9295 | ** | 9 Apr all-time high | S2 | 19.0000 | ** | congestion | |
| R2 | 19.9185 | ** | May 2023 (y) high | S3 | 18.7250 | * | congestion | |
| R1 | 19.5000 | congestion | S4 | 18.5000 | ** | break level |
Asterisk denotes strength of level
12:30 BST - Little change, as prices extend consolidation within the 19.2275 - 19.5000 range. Intraday studies are bearish and daily readings are also turning down, highlighting a deterioration in sentiment and room for further losses in the coming sessions. A close below the 19.2275 monthly high of 13 January will add weight to sentiment and extend losses towards congestion support at 19.0000. Rising weekly charts could limit any initial tests in consolidation. Meanwhile, a close above 19.5000, if seen, will improve sentiment and open up a test of the 19.9185 - 19.9295 barrier. A close above here is needed to turn sentiment outright positive and post fresh historic highs.