Chart USD/ZAR Update: Room for a fresh test above 18.0000

The anticipated test of congestion resistance at 18.0000 has given way to a minor pullback
| Level | Comment | Level | Comment | |||||
|---|---|---|---|---|---|---|---|---|
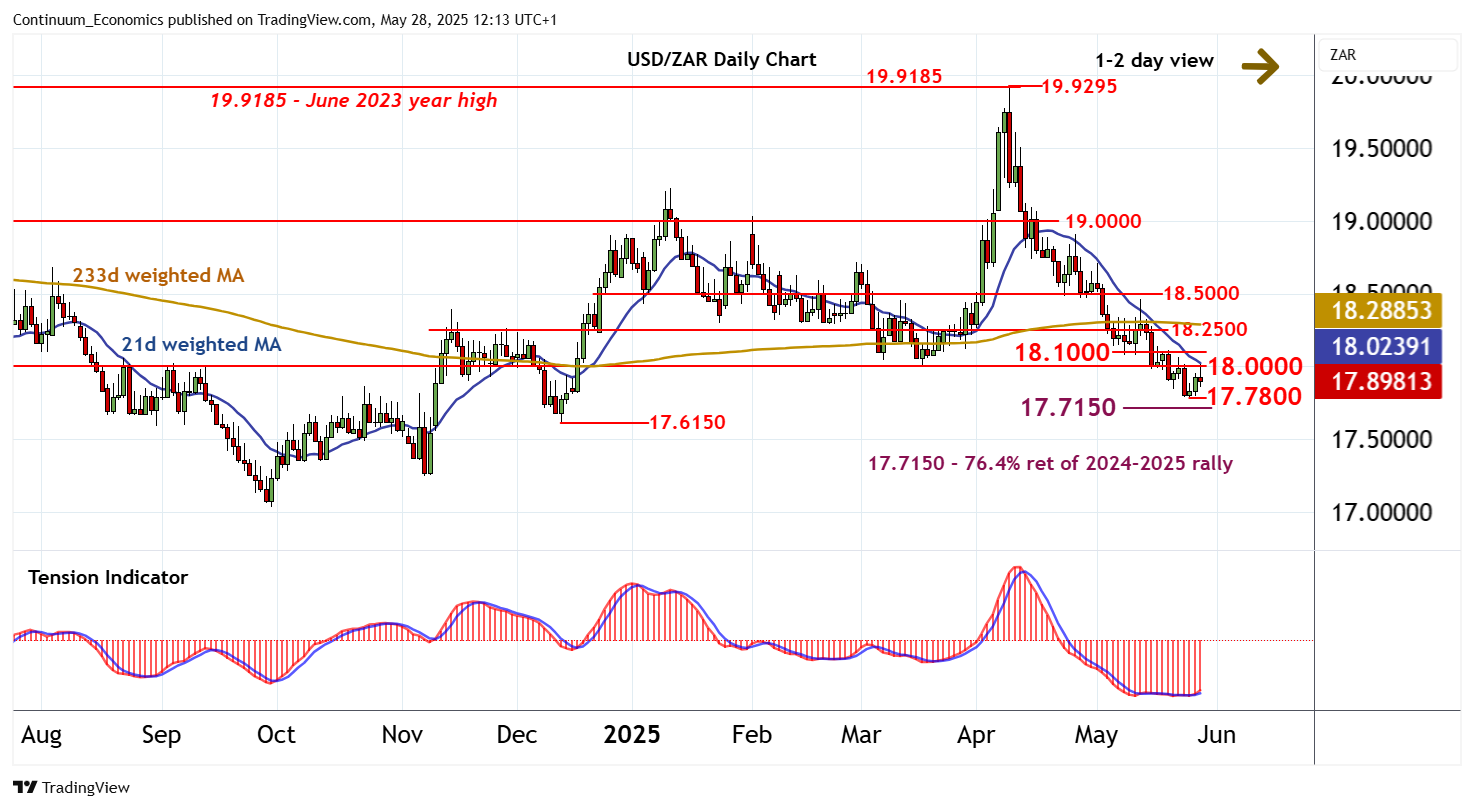
| R4 | 18.5000 | ** | break level | S1 | 17.7800 | ** | 26 May low | |
| R3 | 18.2500 | * | congestion | S2 | 17.7150 | ** | 76.4% ret of 2024-2025 rally | |
| R2 | 18.1000 | * | break level | S3 | 17.6150 | ** | 12 Dec (m) low | |
| R1 | 18.0000 | ** | congestion | S4 | 17.5000 | * | congestion |
Asterisk denotes strength of level
12:00 BST - The anticipated test of congestion resistance at 18.0000 has given way to a minor pullback, as overbought intraday studies unwind, with prices currently trading around 17.8950. Daily stochastics and the daily Tension Indicator have ticked higher, and oversold weekly stochastics are flattening, suggesting room for a fresh test and break towards resistance at 18.1000. But the bearish weekly Tension Indicator and deteriorating longer-term readings should limit any extension beyond here in renewed selling interest towards congestion around 18.2500. Meanwhile, support remains at the 17.7800 low of 26 May. A later break beneath here will add weight to sentiment and extend April losses towards the 17.7150 Fibonacci retracement. Still lower is 17.6150.