Published: 2025-11-06T00:33:17.000Z
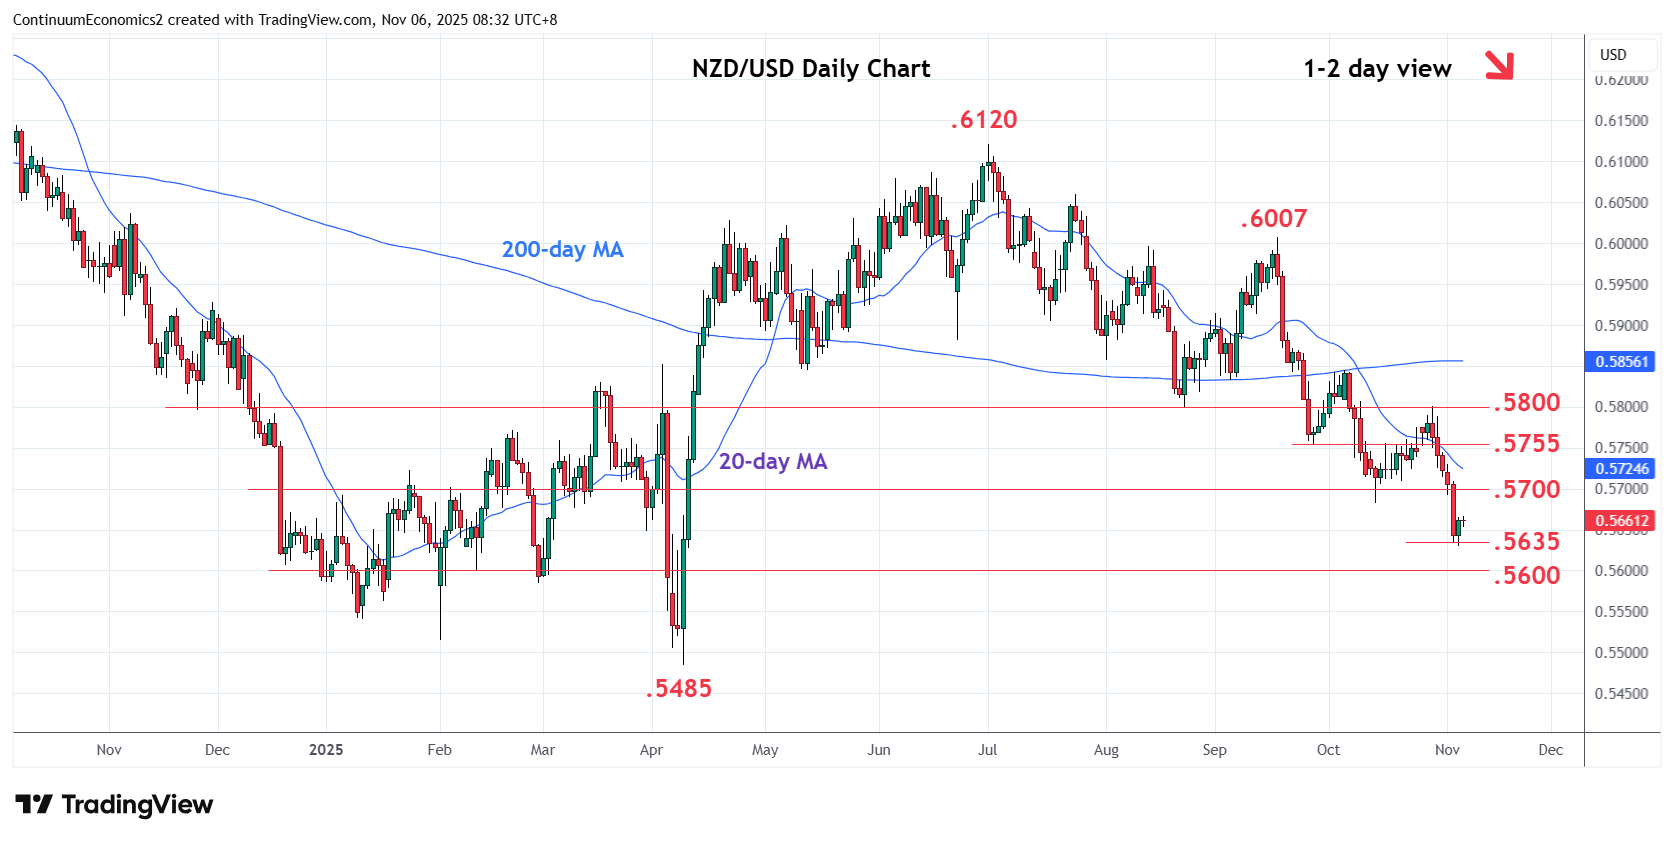
Chart NZD/USD Update: Consolidating test of .5635, 76.4% Fibonacci level
1
Turned up from test of the .5635, 76.4% Fibonacci level, as prices consolidate steep drop from the .5800 high of last week
| Levels | Imp | Comment | Levels | Imp | Comment | |||
|---|---|---|---|---|---|---|---|---|
| R4 | .5845/50 | ** | 6 Oct high, congestion | S1 | .5635 | * | 76.4% Apr/Jul rally | |
| R3 | .5800 | ** | Aug low | S2 | .5600 | * | congestion | |
| R2 | .5755 | * | Sep low | S3 | .5585 | * | congestion | |
| R1 | .5700 | * | congestion | S4 | .5550 | * | congestion |
Asterisk denotes strength of level
00:25 GMT - Turned up from test of the .5635, 76.4% Fibonacci level, as prices consolidate steep drop from the .5800 high of last week. Bounce see prices unwinding oversold intraday studies but bearish momentum keeps pressure on the downside and further losses cannnot be ruled out. Lower will see room to target the .5600 level. However, daily and weekly studies are oversold and caution corrective bounce. Resistance is at the .5700 congestion. Regaining this needed to ease the downside pressure and see room for stronger bounce to retrace losses from .6007, September high.