Published: 2026-01-19T01:42:04.000Z
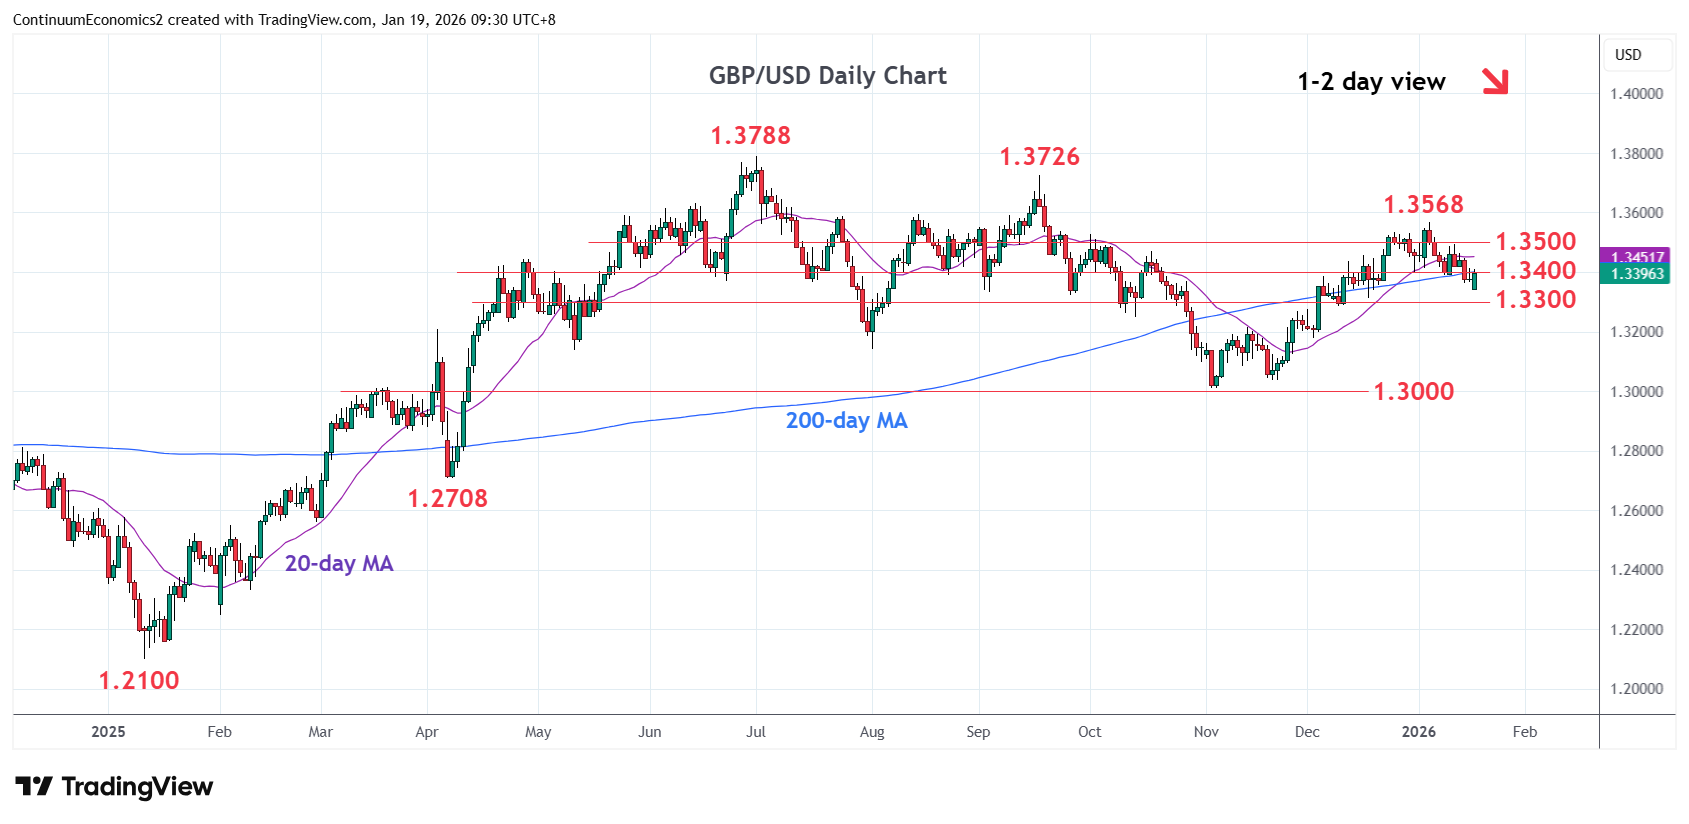
Chart GBP/USD Update: Consolidating losses to 1.3340 low
-
Gapped down opening has given way to bounce from the 1.3340 low as prices unwind oversold intraday studies
| Level | Comment | Level | Comment | |||||
|---|---|---|---|---|---|---|---|---|
| R4 | 1.3600 | * | congestion | S1 | 1.3340 | intraday low | ||
| R3 | 1.3568 | ** | 6 Jan YTD high | S2 | 1.3300 | * | congestion | |
| R2 | 1.3450/00 | * | congestion | S3 | 1.3275/50 | * | congestion | |
| R1 | 1.3400 | * | congestion | S4 | 1.3215/00 | ** | 13 Nov high, congestion |
Asterisk denotes strength of level
01:35 GMT - Gapped down opening has given way to bounce from the 1.3340 low as prices unwind oversold intraday studies. Daily studies are stretched as well and suggest room for stronger bounce to retrace losses from the 1.3568, 6 January high. Above the 1.3400 level will see room for stronger bounce to resistance at the 1.3450/1.3500 congestion area which is expected to cap. A later break of the 1.3340 low will will see room for deeper pullback to retrace gains from the 1.3010 November low and see room for extension to support at the 1.3300 congestion and the 1.3275/50 area.